
 |
 |
|
|
|
|
| DUP | 177470 | 25.6% | +7.5% | 30 seats | +10 |
| SF | 162758 | 23.5% | +5.9% | 24 seats | +6 |
| UUP | 156931 | 22.7% | +1.4% | 27 seats | -1 |
| SDLP | 117547 | 17.0% | -5.0%% | 18 seats | -6 |
| Alliance | 25372 | 3.7% | -2.8%% | 6 seats | +/- 0 |
| PUP | 8032 | 1.2% | -1.4% | 1 seat | -1 |
| Kieran Deeney (West Tyrone) | 6158 | 0.9% | 1 seat | +1 | |
| NIWC | 5785 | 0.8% | -0.8% | -2 | |
| UKUP | 4794 | 0.7% | -3.8% | 1 seat | -4 |
| UUC | 2705 | 0.4% | |||
| Green | 2688 | 0.4% | +0.3% | ||
| SEA | 2394 | 0.35% | |||
| Ivan Davis (Lagan Valley) | 2223 | 0.32% | |||
| WP | 1881 | 0.3% | +/- 0% | ||
| Cons | 1604 | 0.2% | +/- 0% | ||
| Jack McKee (East Antrim) | 1449 | 0.2% | |||
| Brian Wilson (North Down) | 1350 | 0.2% | +/- 0% | ||
| NIUP | 1350 | 0.2% | |||
| Alan Chambers (North Down) | 1077 | 0.2% | |||
| Roger Hutchinson (East Antrim) | 1011 | 0.1% | |||
| Pauline Armitage (East Londonderry) | 906 | 0.1% | |||
| Annie Courtney (Foyle) | 802 | 0.1% | |||
| William Frazer (Newry and Armagh) | 632 | 0.1% | |||
| Gardiner Kane (North Antrim) | 623 | 0.1% | |||
| David Jones (Upper Bann) | 585 | 0.1% | |||
| Sidney Anderson (Upper Bann) | 581 | 0.1% | |||
| Frank McCoubrey (North Belfast) | 469 | 0.1% | |||
| Alan Field (North Down) | 428 | 0.1% | |||
| Robert Lindsay Mason (East Antrim) | 364 | 0.1% | +/- 0% | ||
| John Anderson (East Antrim) | 348 | 0.05% | |||
| Socialist Party | 343 | 0.05% | |||
| Danny McCarthy (Strangford) | 319 | 0.05% | |||
| Raymond McCord (North Belfast) | 218 | 0.03% | |||
| John MacVicar (West Belfast) | 211 | 0.03% | |||
| Malachi Curran (South Down) | 162 | 0.02% | |||
| Danny McBrearty (Foyle) | 137 | 0.02% | |||
| Vote For Yourself Party | 124 | 0.02% | |||
| Chris Carter (North Down) | 109 | 0.02% | +0.01% | ||
| John McBlain (East Belfast) | 72 | 0.01% | |||
| David Kerr (Ulster Third Way) | 16 | 0,00% |

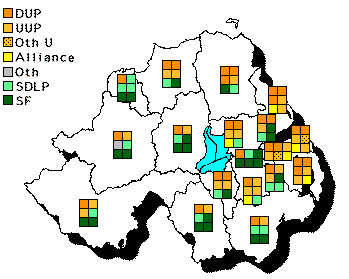
East
Belfast
2 DUP, 2 UUP, 1 Alliance, 1 PUP
North
Belfast 2 DUP, 2 SF, 1 SDLP, 1 UUP
South
Belfast 2 UUP, 2 SDLP, 1 DUP, 1 SF
West
Belfast
4 SF, 1 SDLP, 1 DUP
East
Antrim
3 DUP, 2 UUP, 1 Alliance
North
Antrim 3 DUP, 1 UUP, 1 SDLP, 1 SF
South
Antrim 2 UUP, 2 DUP, 1 SDLP, 1 Alliance
North
Down 2 UUP, 2 DUP, 1 UKUP, 1 Alliance
South
Down 2 SDLP, 2 SF, 1 UUP, 1 DUP
Fermanagh
and
South Tyrone 2 UUP (of whom 1 now DUP), 2 SF, 1 SDLP, 1
DUP
Foyle
3 SDLP, 2 SF, 1 DUP
Lagan
Valley 3 UUP (of whom 2 now DUP), 1 DUP, 1 Alliance, 1
SDLP
East
Londonderry
2 DUP, 2 UUP, 1 SDLP, 1 SF
Mid
Ulster
3 SF, 1 SDLP, 1 DUP, 1 UUP
Newry
and
Armagh 3 SF, 1 SDLP, 1 UUP, 1 DUP
Strangford
3 DUP, 2 UUP, 1 Alliance
West
Tyrone
2 SF, 1 Ind, 1 SDLP, 1 DUP, 1 UUP
Upper
Bann 2 UUP, 2 DUP, 1 SDLP, 1 SF

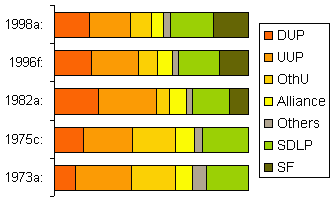
This graph contrasts
the
2003 Assembly election result with the elections of the
Assembly in
1973, the Forum in 1996,
the Assembly in 1982, the Constitutional Convention in 1975
and the
Assembly
in 1973. Here are more details.
The closest results were:
See also: Jim Riley's analysis of votes and seats in the 1998 Assembly election | List of all 1998 candidates
Other sites based at ARK: ORB (Online Research Bank) | CAIN (Conflict Archive on the INternet) | Northern Ireland Life and Times Survey
Your comments, please! Send an email to me at nicholas.whyte@gmail.com.
Nicholas Whyte, 7 December 2003; last modified 6 January 2004.
|
Disclaimer:© Nicholas Whyte 1998-2004 Last
Updated on
Thursday, 11-Mar-2010
16:44
|