

| |
|
|
|
|
|
|
 |
| Map and graph by Conal Kelly | |
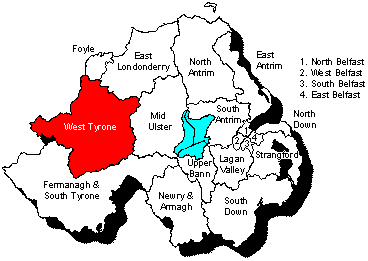
This constituency includes Strabane end of Derry
and Strabane District Council and the Omagh end of Fermanagh
and Omagh District Council. The MP has been Barry McElduff
(SF) since the 2017 election; he took over from Pat Doherty (SF)
who defeated William Thompson (UUP) in 2001. Thompson had won the
seat when it was created for the 1997 election. SF hold three
Assembly seats here, and the SDLP and DUP one each.
The new boundaries see West Tyrone take in adjacent chunks from
Mid Ulster and Foyle. These are small territories, sparsely
populated, and don't make a lot of difference. The SF notional
majority increases from almost 7500 to almost 8100. No impact on
the Assembly result.
2024 Westminster election
Orfhlaith Begley (SF) 22,711 (52.0%, +11.9%)
Tom Buchanan (DUP) 6,794 (15.6%, -6.2%)
Daniel McCrossan (SDLP) 5,821 (13.3%, -5.1%)
Matthew Bell (UUP) 2,683 (6.1%, -0.4%)
Stevan Patterson (TUV) 2,530 (5.8%)
Stephen Donnelly (Alliance) 2,287 (5.2%, -4.3%)
Leza Houston (Aontú) 778 (1.8%)
Stephen Lynch (Con) 91 (0.2%)
Electorate 74,269; total vote 43,935 (59.2%); valid vote 43,695;
invalid 240 (0.5%)
As usual in this election, a consolidation for SF in a strong
area for them.
In a five-seat election, these votes would get SF three seats and
the SDLP and DUP one each, which was also the result of the 2022
election.
2019 Westminster notional result on new boundaries:
SF 17,604 (40.1%)
DUP 9,530 (21.7%)
SDLP 8,108 (18.5%)
Alliance 4,206 (9.6%)
UUP 3,882 (6.6%)
Aontu 1,010 (2.3%)
Green 521 (1.2%)
PBP 30 (0.1%)
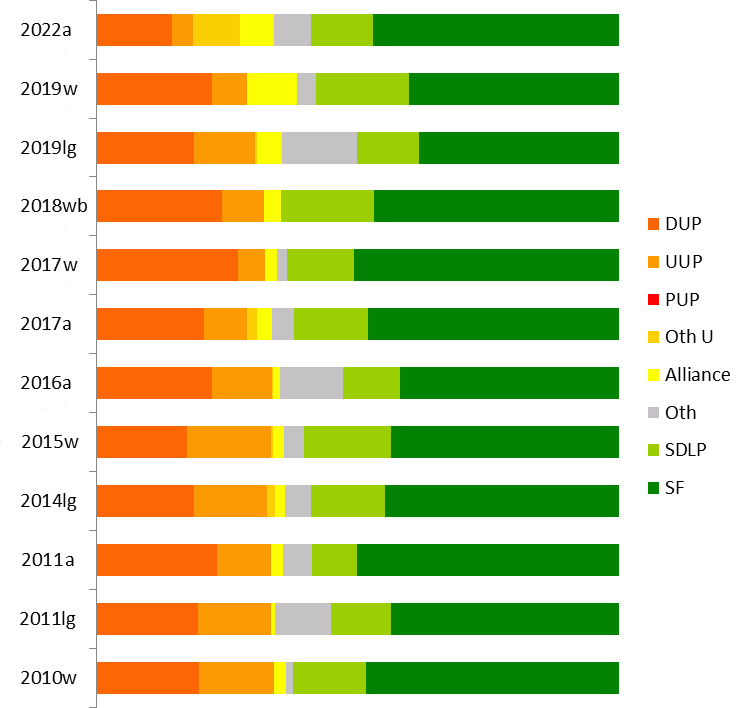
| DUP | UUP | Alliance | Green | PBP | SDLP | SF | Aontu | ||
| 2019 actual |
9,066 | 2,774 | 3,979 | 521 | 7,330 | 16,544 | 972 | ||
| 22.0% | 6.7% | 9.7% | 1.3% | 17.8% | 40.2% | 2.4% | |||
| From West Tyrone |
To West Tyrone |
9,066 | 2,774 | 3,979 | 521 | 7,330 | 16,544 | 972 | |
| From Mid Ulster |
To West Tyrone | 234 | 56 | 198 | 273 | 877 | |||
| From Foyle |
To West Tyrone | 230 | 53 | 29 | 30 | 505 | 184 | 38 | |
| 2019 notional | 9,530 | 3,882 | 4,206 | 521 | 30 | 8,108 | 17,604 | 1,010 | |
| 21.7% | 6.6% | 9.6% | 1.2% | 0.1% | 18.5% | 40.1% | 2.3% | ||
| -0.3% | -0.2% | -0.1% | -0.1% | +0.1% | +0.7% | -0.1% | -0.1% |
| DUP | UUP | Oth U | Alliance | Oth | SDLP | SF | |
| 2024w | 15.6% |
6.1% |
6.0% |
5.2% |
1.8% |
13.3% |
52.0% |
| 2022a | 14.4% | 4.1% | 9.1% | 6.5% | 7.0% | 11.9% | 47.0% |
| 2019w | 22.0% | 6.7% | 9.7% | 3.6% | 17.8% | 40.2% | |
| 2019lg | 18.6% | 11.6% | 0.3% | 4.8% | 15.1% | 11.8% | 38.5% |
| 2017w | 26.9% | 5.2% | 2.3% | 1.9% | 13.0% | 50.7% | |
| 2017a | 20.4% | 8.2% | 2.0% | 2.8% | 4.2% | 14.2% | 48.1% |
| 2016a | 22.0% | 11.4% | 0.1% | 1.3% | 12.0% | 11.0% | 42.0% |
| 2015w | 17.5% | 15.9% | 0.4% | 2.2% | 3.8% | 16.7% | 43.5% |
| 2014lg | 18.7% | 14.1% | 1.5% | 1.9% | 4.9% | 14.3% | 44.7% |
| 2011a | 23.1% | 10.4% | 2.2% | 5.7% | 8.5% | 50.1% | |
| 2011lg | 19.4% | 14.0% | 0.8% | 10.7% | 11.5% | 43.5% | |
| 2010w | 19.8% | 14.2% | 2.3% | 1.4% | 14.0% | 48.4% | |
| 2007a |
21.4% | 8.9% | 0.5% | 10.2% | 14.5% | 44.5% | |
| 2005w | 17.8% | 6.9% | 27.4% | 9.1% | 38.9% | ||
| 2005lg | 19.1% | 13.5% | 0.1% | 6.0% | 17.9% | 43.4% |
NB that the figures for elections before 2010 are projections.
| @Nicola Brogan (SF)
8,626 (18.8%) @Maoliosa McHugh (SF) 6,658 (14.5%) @Thomas Buchanan (DUP) 6,640 (14.4%) @Declan McAleer (SF) 6,343 (13.8%) @Daniel McCrossan (SDLP) 5,483 (11.9%) Trevor Clarke (TUV) 4,166 (9.1%) Stephen Donnelly (Alliance) 2,967 (6.5%) Ian Marshall (UUP) 1,876 (4.1%) Paul Gallagher (Ind) 1,682 (3.7%) James Hope (Aontú) 657 (1.4%) Carol Gallagher (PBP) 354 (0.8%) Susan Glass (Green) 252 (0.5%) Amy Ferguson (SP) 171 (0.4%) Barry Brown (Ind) 119 (0.3%) @ member of the Assembly when it was dissolved. |
SF 21,627 (47.0%, -1.1%)
3 seats DUP 6,640 (14.4%, -6.0%) 1 seat SDLP 5,483 (11.9%, -2.3%) 1 seat TUV 4,166 (9.1%, +7.2%) Alliance 2,967 (6.5%, +3.7%) UUP 1,876 (4.1%, -4.1%) Ind 1,801 (3.9%) Aontú 657 (1.4%) PBP 354 (0.8%) Green 252 (0.5%, -0.4%) SP 171 (0.4%) Electorate: 69,702 Votes cast: 46,629 (66.9%, -3.0%), spoilt votes 635 (1.4%) Valid votes: 45,994, quota 7,666 |
*Órfhlaith Begley (SF) 16,544 (40.2%, -10.6%)
@Thomas Buchanan (DUP) 9,066 (22.%, -4.9%)
@Daniel McCrossan (SDLP) 7,330 (17.8%, +4.8%)
Stephen Donnelly (Alliance) 3,979 (9.7%, +7.4%)
Andy McKane (UUP) 2,774 (6.7%, +1.6%)
James Hope (Aontú) 972 (2.4%, +2.4%)
Susan Glass (Green) 521 (1.3%, +0.3%)
* outgoing MP.
@ member of the Assembly.
Electorate: 66,259; Total Poll: 41,375 (62.4%); Invalid Votes:
189 (0.5%); Valid Votes: 41,186
Begley successfully defended the seat she won in 2018. The drop
in SF support seems to have gone roughly half to SDLP and a
quarter to each of Alliance and Aontu, with Alliance also picking
up from the DUP. In a five-seat Assembly election, these votes
would give SF two seats and the DUP and SDLP one each. The last
seat could go to the DUP or possibly Alliance.
From the 2011 census, West Tyrone includes:
The entire Fermanagh and Omagh DEA of Mid TyroneÓrfhlaith Begley (SF) 16,346 (46.7%, -4.0%)
Thomas Buchanan (DUP) 8,390 (23.9%, -3.0%)
Daniel McCrossan (SDLP) 6,254 (17.9%, +4.9%)
Chris Smyth (UUP) 2,909 (8.3%, +3.2%)
Stephen Donnelly (Alliance) 1,130 (3.2%, +0.9)
Electorate: 64,101; Total Poll: 35,337 (55.1%); Invalid votes 308
(0.9%); Valid Votes 35,029
Barry McElduff resigned after a bizarre incident involving a
Twitter video and a loaf of bread. Sinn Féin easily held the seat.
@Barry McElduff (SF) 22,060 (50.7%, +7.2%)
@Thomas Buchanan (DUP) 11,718 (26.9%, +9.4%)
@Daniel McCrossan (SDLP) 5,635 (13.0%, -3.7%)
Alicia Clarke (UUP) 2,253 (5.2%, -10.7%)
Stephen Donnelly (Alliance) 1,000 (2.3%, +0.1%)
Ciaran McClean (Green) 427 (1.0%, -1.0%)
Barry Brown (CISTA) 393 (0.9%, -0.5%)
* outgoing MP.
@ member of the Assembly
Electorate: 64,009; Total Poll: 43,675 (68.2%); Invalid Votes:
189 (0.4%); Valid Votes: 43,486
McElduff successfully inherited the seat from Pat Doherty. If cast
in a five-seat Assembly election, these votes would elect three SF
MLAs and one DUP, with the last slightly more likely to go to the
second DUP candidate than to the SDLP.
| @Thomas Buchanan (DUP)
9,064 (20.4%) @Michaela Boyle (SF) 7,714 (17.4%) @Barry McElduff (SF) 7,573 (17.1%) @Daniel McCrossan (SDLP) 6,283 (14.2%) @Declan McAleer (SF) 6,034 (13.6%) Alicia Clarke (UUP) 3,654 (8.2%) Stephen Donnelly (Alliance) 1,252 (2.8%) Sorcha McAnespy (Ind) 864 (1.9%) Charlie Chittick (TUV) 851 (1.9%) Ciaran McClean (Green) 412 (0.9%) Barry Brown (CISTA) 373 (0.8%) Corey French (Ind) 98 (0.2%) Roisin McMackin (Ind) 85 (0.2%) Susan-Anne White (Ind) 41 (0.1%) Roger Lomas (Con) 27 (0.1%) @ member of the Assembly when it was dissolved. |
SF 21,321 (48.1%, +6.1%)
3 seats DUP 9,064 (20.4%, -1.6%) 1 seat SDLP 6,283 (14.2%, +3.2%) 1 seat UUP 3,654 (8.2%, -3.2%) 0 seats (-1) Alliance 1,252 (2.8%, +1.5%) Ind 1,088 (2.5%) TUV 851 (1.9%) Green 412 (0.9%, -0.3%) CISTA 373 (0.8%, -0.6%) Con 27 (0.1%, 0.0%) Electorate: 64,258 Votes cast: 44,907 (69.9%, +10.0%), spoilt votes 582 (1.3%) Valid votes: 44,325, quota 7,388 |
| @Thomas Buchanan (DUP)
4,650 (12.0%) @Barry McElduff (Sinn Féin) 4,568 (11.8%) @Michaela Boyle (Sinn Féin) 4,460 (11.5%) @Ross Hussey (UUP) 4,441 (11.4%) @Daniel McCrossan (SDLP) 4,287 (11.0%) Allan Bresland (DUP) 3,884 (10.0%) Grace McDermott (Sinn Féin) 3,711 (9.6%) @Declan McAleer (Sinn Féin) 3,565 (9.2%) Josephine Deehan (Independent) 1,778 (4.6%) Sorcha McAnespy (Independent) 828 (2.1%) Patsy Kelly (Independent) 661 (1.7%) Barry Brown (CISTA) 547 (1.4%) Stephen Donnelly (Alliance) 494 (1.3%) Ciaran McClean (Green) 458 (1.2%) Laura McAnea (Animal Welfare) 224 (0.6%) Corey French (Independent) 124 (0.3%) Susan-Anne White (Independent) 85 (0.2%) Roger Lomas (Conservative) 44 (0.1%) @ member of the Assembly when it was dissolved. |
Sinn Féin 16,304 (42.0%,
-7.9%) 3 seats DUP 8,534 (22.0%, -1.1%) 1 seat UUP 4,441 (11.4%, +1.0%) 1 seat SDLP 4,287 (11.0%, +2.5%) 1 seat Independents 3,476 (9.0%) CISTA 547 (1.4%) Alliance 494 (1.3%, -0.9%) Green 458 (1.2%) Animal Welfare 224 (0.6%) Conservative 44 (0.1%) Electorate: 65,694 Votes cast: 39,325 (59.9%); spoilt votes 516 (1.3%) Valid votes 38,809; quota: 5,545 |
*Pat Doherty (SF) 16,807 (43.5%, -4.9%)
Tom Buchanan (DUP) 6,747 (17.5%, -2.3%)
Daniel McCrossan (SDLP) 6,444 (16.7%, +2.7%)
Ross Hussey (UUP) 6,144 (15.9%, +1.7%)
Stephen Donnelly (Alliance) 869 (2.2%, -0.1%)
Ciaran McClean (Green) 780 (2.0%)
Barry Brown (Cannabis Is Safer Than Alcohol) 528 (1.4%)
Claire-Louise Leyland (Conservative) 169 (0.4%)
Susan-Anne White (Ind) 166 (0.4%)
Electorate: 63,856; Total Poll: 39,014 (61.1%); Invalid Votes: 353
(0.9%); Valid Votes: 38,654
A solid defence from Doherty, though here as elsewhere the vote
slipped.
If cast in a six-seat Assembly election, these votes would have
given SF three seats, and one each to the DUP, SDLP and UUP.
From the 2011 census, West Tyrone includes:
The entire Fermanagh and Omagh DEA of Mid Tyrone| @Barry McElduff (SF) 6,008 (15.3%) @Pat Doherty MP (SF) 5,630 (14.3%) Michaela Boyle (SF) 5,053 (12.9%) @Thomas Buchanan (DUP) 5,027 (12.8%) Ross Hussey (UUP) 4,072 (10.4%) @Allan Bresland (DUP) 4,059 (10.3%) Joe Byrne (SDLP) 3,353 (8.5%) Declan McAleer (SF) 3,008 (7.7%) Paddy McGowan (Independent) 1,145 (2.9%) Eugene McMenamin (Independent) 1,096 (2.8%) Eric Bullick (Alliance) 852 (2.2%) @ member of the Assembly when it was dissolved. |
SF 19,699 (50.1%, +7.6%)
3 seats DUP 9,086 (23.1%, +1.7%) 1 seat (-1) UUP 4,072 (10.4%, +2.5%) 1 seat (+1) SDLP 3,353 (8.5%, -6.0%) 1 seat (+1) Independents 2,241 (5.7%) (-1) Alliance 852 (2.2%) Electorate: 62,970 Votes cast: 40,323 (64.0%); spoilt votes 1020 (2.5%) Valid votes 39,282; quota: 5,615 |
Two changes here, the only constituency
where this was true. The SDLP managed to regain the seat they
should never have lost to independent MLA Kieran Deeny in 2007,
despite the interventions of two former SDLP members running as
independents. And the UUP regained the seat they should not really
have lost to the DUP in 2007, one which the DUP had (I understand)
written off before the election, but which they still came fairly
close to hanging on to, Bresland losing to Hussey by 274 votes on
the last count.
*@Pat Doherty (Sinn Féin) 18,050 (48.4%, +9.5%)
@Thomas Buchanan (DUP) 7,365 (19.8%, +2.0%)
Ross Hussey (UCUNF) 5,281 (14.2%, +7.3%)
Joe Byrne (SDLP) 5,212 (14.0%, +4.9%)
Michael Bower (Alliance) 859 (2.3%)
Ciaran McClean (Independent) 508 (1.4%)
Electorate: 61,148; Total Poll: 37,632 (61.5%); Invalid Votes: 357
(9.5%); Valid Votes: 37,275
* incumbent
@ elected to the Northern Ireland Assembly from this constituency
A solid performance from SF in one of their stronger constituencies. If these votes were cast in a six-seat Assembly election, the SDLP would win the seat currently held by Kieran Deeny, SF would retain their three, and the UUP/UCUNF would gain a seat from the DUP.
| *Barry McElduff (SF) 6971 (16.8%) *Pat Doherty MP (SF) 6709 (16.2%) Claire McGill (SF) 4757 (11.5%) *Thomas Buchanan (DUP) 4625 (11.2%) Allan Bresland (DUP) 4244 (10.2%) *Kieran Deeny (Independent) 3776 (9.1%) *Derek Hussey (UUP) 3686 (8.9%) Josephine Deehan (SDLP) 2689 (6.5%) *Eugene McMenamin (SDLP) 2272 (5.5%) Seamus Shields (SDLP) 1057 (2.5%) Joseph O'Neill (RSF) 448 (1.1%) ^Robert McCartney (UKUP) 220 (0.5%) *Elected in 2003 from West Tyrone ^Elected in 2003 from North Down |
SF 18,437 (44.5%, +5.9%) 3 seats (+1) DUP 8,869 (21.4%, +3.9%) 2 seats (+1) SDLP 6,018 (14.5%, -0.1%) (-1) Ind 3,776 (9.1%, -5.6%) 1 seat UUP 3,686 (8.9%, -4.7%) (-1) RSF 448 (1.1%) UKUP 220 (0.5%) Electorate 58,367 Votes cast 41,839 (71.7%); spoilt votes 385 (0.9%) Valid votes 41,454; quota 5,923 |
*@Pat Doherty (Sinn Fein) 16,910 (38.9% -1.9%)
@Kieran Deeny (Independent) 11,905 (27.4%)
@Thomas Buchanan (DUP) 7,742 (17.8%)
@Eugene McMenamin (SDLP) 3,949 (9.1% -19.6%)
@Derek Hussey (UUP) 2,981 (6.9% -23.5%)
* outgoing MP
@ Member of the Assembly
If these votes were cast in a six-seat STV election, SF would have won three seats, Kieran Deeny two and the DUP one.
First preference votes cast in the whole of the Omagh and Strabane council areas were as follows:
Sinn Fein 18,703 (43.4%)
DUP 8,246 (19.1%)
SDLP 7,698 (17.9%)
UUP 5,814 (13.5%)
PUP 64 (0.1%)
Independents 2,588 (6.0%)
If these votes were cast in a six-seat STV election, SF would win three and the DUP, SDLP and UUP one each.
| Kieran Deeney
(Ind) 6158 (14.8%) *Pat Doherty (SF) 6019 (14.4%) *Barry McElduff (SF) 5642 (13.5%) Thomas Buchanan (DUP) 4739 (11.4%) Brian McMahon (SF) 4450 (10.7%) *Derek Hussey (UUP) 3733 (8.9%) *Eugene McMenamin (SDLP) 3465 (8.3%) *Joe Byrne (SDLP) 2645 (6.3%) Derek Reaney (DUP) 2547 (6.1%) Bert Wilson (UUP) 1934 (4.6%) Roy Reid (PUP) 233 (0.6%) Steven Alexander (Alliance) 164 (0.4%) |
SF 16,111 (38.6%, +4.5%) 2 seats DUP 7,286 (17.5%, +0.1%) 1 seat Ind 6,158 (14.8%) 1 seat (+1) SDLP 6,110 (14.6%, -11.1%) 1 seat (-1) UUP 5,667 (13.6%, -2.1%) 1 seat PUP 233 (0.6%) Alliance 164 (0.4%, -1.8%) Electorate 57,795 |
Electorate: 60,739; votes cast: 48,964 (80.6%); spoilt votes: 434
(0.8%)
Valid votes: 48,530; SF majority 5,040
* outgoing MP
@ Member of the Assembly
A particularly dramatic SF gain; the SDLP had foolishly been talking up their chances here, but in the event came third. A six-seat Assembly election on these figures would give two seats each to SF, the UUP and the SDLP, though only a very small increase in the SF vote would give them three seats and the SDLP one.
SF 19,398 (40%)
SDLP 10,009 (21%)
UUP 7,733 (16%)
DUP 7,657 (16%)
WP 211 (0.4%)
Inds 3,088 (6%)
Total valid votes 48,096 (79.1% of electorate)
It is easy enough to extrapolate from the local council elections because the West Tyrone constituency includes two whole district councils. The votes cast would have given the two Unionist parties a seat each, and probably one to the SDLP and three to Sinn F�in.
| *Oliver Gibson (DUP) 8,015 #Pat Doherty (SF) 7,027 *Joe Byrne (SDLP) 6,495 *Barry McElduff (SF) 4,963 *Derek Hussey (UUP) 4,622 Seamus Devine (SF) 3,676 Eugene McMenamin (SDLP) 3,548 Alastair Patterson (UUP) 2,615 Pat McDonnell (SDLP) 1,772 *Paddy McGowan (Ind Community) 1,269 Ann Gormley (Alliance) 1,011 Johnny McLaughlin (Pro-Agreement Socialist) 570 Laurence O'Kane (Community and Environmental Conservation Campaign) 171 Tommy Owens (WP) 157 Robert Johnstone (NLP) 40 |
SF 15,666 (34.09%) 2 seats
SDLP 11,815 (25.71%) 2 seats DUP 8,015 (17.44%) 1 seat UUP 7,237 (15.75%) 1 seat Ind Comm 1,269 (2.76%) Alliance 1,011 (2.20%) Soc 570 (1.24%) CECC 171 (0.37%) WP 157 (0.34%) NLP 40 (0.09%) Electorate 59,081 |
The most predictable result in Northern Ireland. Barry McElduff finished with 5,997 votes, far ahead of his running mate Seamus Devine's 4,088.
* elected in 1996 Forum/talks election from West TyroneSinn Féin 13,388 votes (32%)
Social Democratic and Labour Party 9,588 votes (23%)
Ulster Unionist Party 8,770 votes (21%)
Democratic Unionist Party 6,080 votes (15%)
Alliance Party of Northern Ireland 926 votes (2%)
Labour 711 votes (2%)
Workers Party 457 votes (1%)
Democratic Left 148 votes (0.48%)
Ulster Independence Movement 42 votes (0.10%)
Others 1469 votes (4%)
Total valid votes 41,580 (71.08% of electorate)
Social Democratic and Labour Party (SDLP) 11,622 (28%); Joe
Byrne, Paddy McGowan elected
Sinn Féin (SF) 11,516 (28%); Barry McElduff elected
Ulster Unionist Party (UUP) 7,327 (18%); Derek Hussey elected
Democratic Unionist Party (DUP) 6,727 (16%); Oliver Gibson elected
Alliance Party of Northern Ireland (APNI) 1,081 (3%)
Labour (Lab) 792 (2%)
Ulster Democratic Party (UDP) 397 (1%)
United Kingdom Unionist Party (UKUP) 292 (1%)
Progressive Unionist Party (PUP) 238 (1%)
Northern Ireland Women's Coalition (NIWC) 185 (0.45%)
Green Party 158 (0.39%)
Workers Party (WP) 169 (0.41%)
Democratic Left (DL) 130 (0.32%)
Conservative Party (Con) 119 (0.29%)
Ulster Independence Movement (UIM) 107 (0.26%)
Natural Law Party (NLP) 45 (0.11%)
Independent Chambers 30 (0.07%)
Electorate: 57,348; votes cast: 41,146 (71.7%); spoilt votes: 211 (0.5%); valid votes: 40,935
| DUP | UUP | Oth U | Alliance | Oth | SDLP | SF | |
| 2007a |
21% | 9% | 1% | 10% | 15% | 44% | |
| 2005w | 18% | 7% | 27% | 9% | 39% | ||
| 2005lg | 19% | 13% | 0% | 6% | 18% | 43% | |
| 2003a | 17% | 14% | 1% | 0% | 15% | 15% | 39% |
| 2001w | 30% | 29% | 41% | ||||
| 2001lg | 16% | 16% | 7% | 21% | 40% | ||
| 1998a | 17% | 16% | 2% | 5% | 26% | 34% | |
| 1997lg | 15% | 21% | 2% | 7% | 23% | 32% | |
| 1997w | 35% | 2% | 1% | 32% | 31% | ||
| 1996f | 16% | 18% | 3% | 3% | 4% | 28% | 28% |
See also: Full 2003 results from West Tyrone | Full 1998 results from West Tyrone | The Boundary Commission's Provisional Recommendations | Boundary Commission 2003 | Jim Riley's analysis of votes and seats in the 1998 Assembly election | The constituencies
Other sites based at ARK: ORB (Online Research Bank) | CAIN (Conflict Archive on the INternet) | Northern Ireland Life and Times Survey
Your comments, please! Send an email to me at nicholas.whyte@gmail.com.
 |
This page has been developed with the support of a project grant from the New Initiatives Fund of the Electoral Commission. However, any views expressed on this page or, in particular, other pages of this website are those of the author and not necessarily shared by The Electoral Commission. |
Nicholas Whyte, 3 June 1998; last updated 7 May 2022 by Conal Kelly.
|
Disclaimer:� Nicholas Whyte 1998-2015
|