

| |
|
|
|
|
|
|
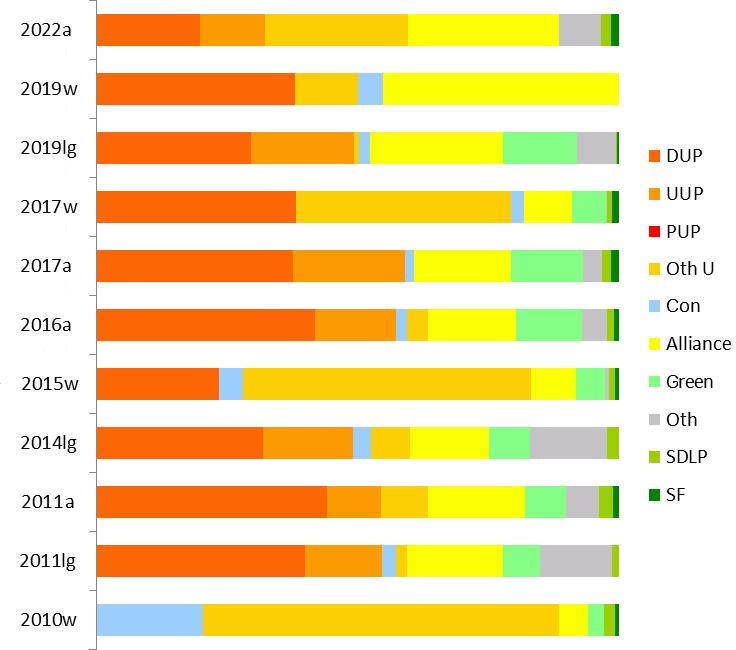 |
| Map and graph by Conal Kelly | |
This constituency takes in the northern part of North Down and Ards District Council. The
member of parliament is Alex Easton (Independent Unionist); in
2024 he replaced Stephen Farry (Alliance), who had been elected in
2019. The previous MP was Sylvia Hermon (Independent - she left
the UUP in early 2010) who retired, having represented North Down
since the 2001 election. Standing as a UUP candidate, she had
defeated the UKUP leader, Bob McCartney, who himself had first won
the seat in a 1995 by-election caused by
the death of Sir James Kilfedder, the leader of the Ulster Popular
Unionist Party, who had represented North Down since the 1970s.
At the Assembly Alliance hold two seats here, and the DUP and UUP
one each, with the last won by Independent Alex Easton (formerly
of the DUP). See 1983-1995 North Down results,
1973-82 North Down results and 1950-1970 North Down results.
2019 Westminster notional result on new boundaries:
| DUP | UUP | Cons | Alliance | ||
| 2019 actual | 15,390 | 4,936 | 1,959 | 18,358 | |
| 37.9% | 12.1% | 4.8% | 45.2% | ||
| From North Down |
To North Down | 15,390 | 4,936 | 1,959 | 18,358 |
| From East Belfast |
To North Down | 1,148 | 138 | 0 | 823 |
| From Strangford |
To North Down | 3 | 1 | 0 | 2 |
| 2019 notional | 16,541 | 5,075 | 1,959 | 19,182 | |
| 38.7% | 11.9% | 4.6% | 44.9% | ||
| 0.8% | -0.3% | -0.2% | -0.3% |
| DUP | UUP | Cons | Oth U | Alliance | Green | Oth | SDLP | SF | |
| 2024w | 15.6% |
48.3% |
31.4% |
2.9% |
0.3% |
1.5% |
|||
| 2022a | 19.9% | 12.4% | 0.6% | 26.7% | 28.9% | 6.5% | 1.6% | 1.7% | 1.6% |
| 2019w | 37.9% | 12.1% | 4.8% | 45.2% | |||||
| 2019lg |
29.5% | 19.8% | 2.1% | 0.9% | 25.6% | 14.4% | 7.3% | 0.1% | 0.3% |
| 2017w | 38.1% | 2.4% | 41.2% | 9.3% | 6.5% | 0.1% | 1.0% | 1.4% | |
| 2017a |
37.5% | 21.5% | 1.7% | |
18.6% | 13.7% | 3.6% | 1.8% | 1.6% |
| 2016a |
41.7% | 15.5% | 2.1% | 4.0% | 16.8% | 12.7% | 4.9% | 1.3% | 1.0% |
| 2015w |
23.6% | 4.4% | 55.2% | 8.6% | 5.4% | 0.9% | 1.0% | 0.8% | |
| 2014lg |
31.9% | 17.3% | 3.4% | 7.5% | 15.1% | 7.9% | 14.6% | 2.3% | 0.0% |
| 2011a |
44.2% | 10.4% | 8.9% | 18.6% | 7.9% | 6.3% | 2.7% | 1.0% | |
| 2011lg |
38.8% | 14.3% | 2.6% | 2.0% | 17.9% | 6.8% | 13.5% | 1.2% | |
| 2010w | 20.4% | 68.2% | 5.6% | 3.1% | 2.0% | 0.8% | |||
| 2007a |
34.1% | 23.7% | 2.8% | 7.1% | 10.2% | 9.2% | 8.0% | 3.6% | 1.3% |
| 2005w | 35.1% | 50.4% | 2.5% | 7.6% | 0.7% | 3.1% | 0.6% | ||
| 2005lg | 34.3% | 22.8% | 1.1% | 4.3% | 15.4% | 8.2% | 12.2% | 1.6% | |
NB that the UUP supported a Conservative candidate in 2010, and the Conservatives supported the UUP in the 2011 Assembly election.
| @Alex Easton (Ind U)
9,568 (22.9%) @Andrew Muir (Alliance) 6,838 (16.4%) @Stephen Dunne (DUP) 6,226 (14.9%) Connie Egan (Alliance) 5,224 (12.5%) @Alan Chambers (UUP) 3,825 (9.2%) @Rachel Woods (Green) 2,734 (6.5%) Jennifer Gilmour (DUP) 2,068 (5.0%) John Gordon (TUV) 1,574 (3.8%) Naomi McBurney (UUP) 1,342 (3.2%) Déirdre Vaughan (SDLP) 727 (1.7%) Therese McCartney (SF) 687 (1.6%) Ray McKimm (Ind) 604 (1.4%) Matthew Robinson (Con) 254 (0.6%) Chris Carter (Ind) 72 (0.2%) @ member of the Assembly when it was dissolved. |
Alliance 12,062 (28.9%,
+10.3%) 2 seats Ind U 9,568 (22.9%) 1 seat DUP 8,294 (19.9%, -17.6%) 1 seat UUP 5,167 (12.4%, -9.1%) 1 seat Green 2,734 (6.5%, -7.2%) (-1) TUV 1,574 (3.8%) SDLP 727 (1.7%, -0.1%) SF 687 (1.6%, ±0%) Ind 676 (1.6%) Con 254 (0.6%, -1.1%) Electorate: 70,176 Votes cast: 42,198 (60.1%, +0.9%), spoilt votes 455 (1.1%) Valid votes: 41,743, quota 6,958 |
@Stephen Farry (Alliance) 18,358 (45.2%, +35.9%)
@Alex Easton (DUP) 15,390 (37.9%, -0.3%)
@Alan Chambers (UUP) 4,936 (12.1%, +12.1%)
Matthew Robinson (Cons) 1,959 (4.8%, +2.4%)
@ member of the Assembly.
Electorate: 67,099; Total Poll: 40,842 (60.9%); Invalid Votes:
199 (0.5%); Valid Votes: 40,643
In the surprise result of the election, Farry managed to inherit
Lady Hermon's support base while also benefiting from the absence
of the Greens, the SDLP and SF. This was Alliance's highest ever
vote share in a Westminster election. This was also the
Conservatives best result in Northern Ireland. In a five-seat
Assembly election, these votes would give Alliance and the DUP two
seats each. The last seat would be between the UUP and a third
Alliance, with the UUP slightly ahead.
From the 2011 census, North Down includes:
The entire North Down and Ards DEA of Bangor Central
The entire North Down and Ards DEA of Bangor East and Donaghadee
The entire North Down and Ards DEA of Bangor West
The entire North Down and Ards DEA of Holywood and Clandeboye
11% of the North Down and Ards DEA of Ards Peninsula
and
1% of the Belfast DEA of Ormiston
With some adjustment for voter community background, I project the
2019 results as:
DUP 8,411 (29.5%)
Alliance 7,296 (25.6%)
UUP 5,634 (19.8%)
Green 4,089 (14.4%)
Inds 2,086 (7.3%)
Cons 610 (2.1%)
UKIP 250 (0.9%)
SF 74 (0.3%)
SDLP 22 (0.1%)
PUP 4 (0.01%)
If cast in a five-seat STV election, those votes would give the
DUP two seats and Alliance, the UUP and the Greens one each.
*Sylvia Hermon (Ind) 16,148 (41.2%, -8.0%)
@Alex Easton (DUP) 14,940 (38.1%, +14.5%)
Andrew Muir (Alliance) 3.639 (9.3%, +0.7%)
@Steven Agnew (Green) 2,549 (6.5%, +1.1%)
Frank Shivers (Con) 941 (2.4%, -2.0%)
Therese McCartney (SF) 531 (1.4%, +0.6%)
Caoímhe McNeill (SDLP) 400 (1.0%, ±0)
Gavan Reynolds (Ind) 37 (0.1%)
* outgoing MP.
@ member of the Assembly.
Electorate: 64,334; Total Poll: 39,268 (61.0%); Invalid Votes:
83 (0.2%); Valid Votes: 39,185
Hermon's narrowest squeak since she was first elected, with the
DUP snapping ever closer at her heels. In a five-seat Assembly
election, these votes would give her two seats, the DUP two and
probably Alliance the last one.
| @Alex Easton (DUP) 8,034
(21.3%) @Alan Chambers (UUP) 7,151 (18.9%) @Stephen Farry (Alliance) 7,014 (18.6%) @Gordon Dunne (DUP) 6,118 (16.2%) @Steven Agnew (Green) 5,178 (13.7%) Melanie Kennedy (Ind) 1,246 (3.3%) William Cudworth (UUP) 964 (2.6%) Caoímhe McNeill (SDLP) 679 (1.8%) Frank Shivers (Con) 641 (1.7%) Kieran Maxwell (SF) 591 (1.6%) Chris Carter (Ind) 92 (0.2%) Gavan Reynolds (Ind) 31 (0.1%) @ member of the Assembly when it was dissolved. |
DUP 14,152 (37.5%, -4.2%)
2 seats (-1) UUP 8,115 (21.5%, +6.0%) 1 seat Alliance 7,014 (18.6%, +1.8%) 1 seat Green 5,178 (13.7%, +1.0%) 1 seat Ind 1,369 (3.6%) SDLP 679 (1.8%, +0.5%) Con 641 (1.7%, -0.4%) SF 591 (1.6%, +0.6%) Electorate: 64,461 Votes cast: 38,174 (59.2%, +9.2%), spoilt votes 435 (1.1%) Valid votes: 37,739, quota 6,290 |
| @Alex Easton (DUP) 6,357
(19.7%) @Gordon Dunne (DUP) 4,004 (12.4%) @Steven Agnew (Green) 4,109 (12.7%) Alan Chambers (UUP) 3,275 (10.2%) @Peter Weir (DUP) 3,085 (9.6%) @Stephen Farry (Alliance) 3,012 (9.3%) Andrew Muir (Alliance) 2,387 (7.4%) Carl McClean (UUP) 1,495 (4.6%) Brian Wilson (Independent) 1,415 (4.4%) Bill Piper (UKIP) 681 (2.1%) Frank Shivers (Conservatives) 672 (2.1%) John Brennan (TUV) 610 (1.9%) Conal Browne (SDLP) 426 (1.3%) Therese McCartney (Sinn Féin) 307 (1.0%) Chris Eisenstadt (UUP) 217 (0.7%) Maria Lourenco (NI Labour) 177 (0.5%) @ member of the Assembly when it was dissolved. |
DUP 13,446 (41.7%, -2.5%)
3 seats Alliance 5,399 (16.8%, -1.8%) 1 seat UUP 4,987 (15.5%, +5.1%) 1 seat Green 4,109 (12.7%, +4.8%) 1 seat Independent 1,415 (4.4%) UKIP 681 (2.1%, -0.1%) Conservatives 672 (2.1%) TUV 610 (1.9%) SDLP 426 (1.3%, -1.4%) Sinn Féin 307 (1.0%, no change) NI Labour 177 (0.5%) Electorate 65,760 Votes cast 32,597 (50.0%); spoilt votes 368 (1.1%) Valid votes 32,229; quota 4,605 |
*Sylvia Hermon (Independent) 17,689 (49.2%, -14.1%)
Alex Easton (DUP) 8,487 (23.6%)
Andrew Muir (Alliance) 3,086 (8.6%, +3.0%)
Steven Agnew (Green) 1,958 (5.4%, +2.3%)
Mark Brotherston (Conservative) 1,593 (4.4%)
Jonny Lavery (UKIP) 1,482 (4.1%)
William Cudworth (TUV) 686 (1.9%, -3.0%)
Tom Woolley (SDLP) 355 (1.0%, -1.0%)
Glenn Donnelly (Cannabis Is Safer Than Alcohol) 338 (0.9%)
Therese McCartney (SF) 273 (0.8%, ±0.0%)
Electorate: 64,207; Total Poll: 36,041 (56.1%); Invalid Votes: 97
(0.3%); Valid Votes: 35,944
Hermon's vote dropped considerably due to tactical unwind from the
2010 election, but she was still returned by a decent margin.
If cast in a six-seat Assembly election, these votes would have
given her three seats, the DUP two and Alliance one.
From the 2011 census, North Down includes:
The entire North Down and Ards DEA of Bangor Central
The entire North Down and Ards DEA of Bangor East and Donaghadee
The entire North Down and Ards DEA of Bangor West
The entire North Down and Ards DEA of Holywood and Clandeboye
11% of the North Down and Ards DEA of Ards Peninsula
and
1% of the Belfast DEA of Ormiston
With some adjustment for voter community background, I project the
2014 results as:
DUP 8249 (32%)
UUP 4483 (17%)
Alliance 3910 (15%)
Inds 2451 (9%)
Green 2031 (8%)
TUV 1159 (4%)
NI21 924 (4%)
Cons 888 (3%)
UKIP 759 (3%)
SDLP 592 (2%)
Community Partnership 399 (2%)
PUP 7 (0.03%)
SF 6 (0.02%)
If cast in a six-seat STV election, those votes would certainly
give the DUP two seats and the UUP and Alliance one each. The last
two would be most likely to go to the Greens and the third DUP
candidate, depending on balancing.
| @Alex Easton (DUP) 5,175 (18.4%) Gordon Dunne (DUP) 3,741 (13.3%) @Peter Weir (DUP) 3,496 (12.4%) @Stephen Farry (Alliance) 3,131 (11.1%) Steven Agnew (Green) 2,207 (7.9%) Anne Wilson (Alliance) 2,100 (7.5%) @Alan McFarland (Independent) 1,879 (6.7%) Alan Chambers (Independent) 1,765 (6.3%) Leslie Cree (UUP) 1,585 (5.6%) Colin Breen (UUP) 1,343 (4.8%) Liam Logan (SDLP) 768 (2.7%) Fred McGlade (UKIP) 615 (2.2%) Conor Keenan (SF) 293 (1.0%) @ member of the Assembly when it was dissolved. |
DUP 12,412 (44.2%, +10.1%)
3 seats (+1) Alliance 5,231 (18.6%, +8.4%) 1 seat Independents 3,624 (13.0%) UUP 2,928 (10.4%, -13.3%) 1 seat (-1) Green 2,207 (7.9%, -1.4%) 1 seat SDLP 768 (2.7%, -0.9%) UKIP 615 (2.2%) SF 293 (1.0%, -0.3%) Electorate 62,170 Votes cast 28,528 (45.9%); spoilt votes 430 (1.5%) Valid votes 28,098; quota 4,015 |
Agnew held the Green seat by 99 votes
ahead of Alliance's Anne Wilson, with 62 votes of Stephen Farry's
surplus undistributed, which makes this realistically an even
tighter result than Fermanagh-South Tyrone. Wilson had survived
elimination on a previous round by being 45 votes ahead of Alan
McFarland, though probably her votes would not have changed the
final result; McFarland had been 95 votes ahead of Chambers in a
previous round. DUP gain from UUP, with the UUP vote utterly
splintered and devastated, in a seat which they held at
Westminster until their MP's resignation from the party only a
year or so before.
*Sylvia Hermon (Independent)
21,181 (63.3%)
Ian Parsley (UCUNF) 6,817 (20.4%, -32.5%)
@Stephen Farry (Alliance) 1,876 (5.6%, -2.0%)
Mary Kilpatrick (TUV) 1,634 (4.9%)
Steven Agnew (Green) 1,043 (3.1%)
Liam Logan (SDLP) 680 (2.0%, -1.1%)
Vincent Parker (Sinn Féin) 250 (0.8%, +0.2%)
* incumbent
@ elected to the Northern Ireland Assembly from this constituency
A storming performance by incumbent Sylvia Hermon, who clearly took votes from all her political party rivals; she was helped by the DUP's decision not to contest but I think would have narrowly beaten them anyway even if she had stood. North Down was already unusual as the only constituency where different parties topped the poll in 2005 and 2007; it was remarkable that neither of those parties had its own candidate here in 2010, Parsley being one of two Conservatives in the UCUNF alliance. If this had been an Assembly election, Lady Hermon would have won four seats on her own, the UCUNF one, and the last one between Lady Hermon's fifth self, a second UCUNF candidate and Alliance.
| *Alex Easton (DUP) 4946
(16.1%) *Peter Weir (DUP) 3376 (11.0%) Stephen Farry (Alliance) 3131 (10.2%) *Leslie Cree (UUP) 2937 (9.6%) Brian Wilson (Green) 2839 (9.2%) *Alan McFarland (UUP) 2245 (7.3%) Alan Graham (DUP) 2147 (7.0%) Marion Smith (UUP) 2098 (6.8%) *Robert McCartney (UKUP) 1806 (5.9%) Brian Rowan (Independent) 1194 (3.9%) Alan Chambers (Independent Unionist) 1129 (3.7%) William Logan (SDLP) 1115 (3.6%) James Leslie (Conservative) 864 (2.8%) Deaglan Page (SF) 390 (1.3%) Elaine Martin (PUP) 367 (1.2%) Christopher Carter (Independent) 123 (0.4%) *Elected in 2003 from North Down |
DUP 10,469 (34.1%, +10.6%) 2 seats UUP 7,280 (23.7%, -8.4%) 2 seats Alliance 3,131 (10.2%, +1.6%) 1 seat Green 2,839 (9.2%, +6.9%) 1 seat (+1) UKUP 1,806 (5.9%, -5.7%) (-1) Rowan 1,194 (3.9%) Chambers 1,129 (3.7%, +0.2%) SDLP 1,115 (3.6%, -1.3%) Conservative 864 (2.8%, +1.2%) SF 390 (1.3%, +0.4%) PUP 367 (1.2%, +0.2%)) Carter 123 (0.4%, +0.05%) Electorate 57,525 Votes cast 30,930 (53.8%); spoilt votes 223 (0.7%) Valid votes 30,707; quota 4,387 |
*Lady Sylvia Hermon (UUP) 16,268 (50.4% -5.6%)
@Peter Weir (DUP) 11,324 (35.1%)
David Alderdice (Alliance) 2,451 (7.6%)
Liam Logan (SDLP) 1,009 (3.1% -0.3%)
Julian Robertson (Conservative) 822 (2.5% +0.3%)
Chris Carter (Independent) 211 (0.7%)
Janet McCrory (Sinn Fein) 205 (0.6% -0.2%)
* outgoing MP.
@ Member of the Assembly.
A big relief for the UUP who would otherwise have been left with no Westminster seats - but Lady Hermon clearly owes her victory to Alliance tactical votes. These results, projected to a six-seat STV election, would give the UUP three and the DUP two, with the last probably going to Alliance.
The constituency comprises the whole of North Down Council and 3 of the 6 wards of the Ards East DEA of Ards Council (Donaghadee North, Donaghadee South and Millisle). Votes cast in 2005 were:
DUP 11,034 (34.3%)
UUP 7,343.5 (22.8%)
Alliance 4,958 (15.4%)
Independent 3,180 (9.9%)
Green 2,639 (8.2%)
Women's Coalition 738 (2.3%)
UKUP 734 (2.3%)
PUP 651 (2.0%)
SDLP 526 (1.6%)
Conservative 353 (1.1%)
If these votes were cast in a six-seat STV election, the DUP would have two seats and the UUP and Alliance one each; the last two would be most likely to go to the UUP and the Green Party.
| Leslie Cree
(UUP) 3900 (12.6%) *Peter Weir (DUP) 3675 (11.9%) Alex Easton (DUP) 3570 (11.6%) *Alan McFarland (UUP) 3421 (11.1%) *Robert McCartney (UKUP) 3374 (10.9%) Diana Peacocke (UUP) 2566 (8.3%) *Eileen Bell (Alliance) 1951 (6.3%) Liam Logan (SDLP) 1519 (4.9%) Brian Wilson (Ind) 1350 (4.4%) *Jane Morrice (NIWC) 1181 (3.8%) Alan Chambers (Ind) 1077 (3.5%) John Barry (Green) 730 (2.4%) Stephen Farry (Alliance) 704 (2.3%) Julian Robertson (Cons) 491 (1.6%) Alan Field (Ind) 428 (1.4%) David Rose (PUP) 316 (1.0%) Maria George (SF) 264 (0.9%) Tom Sheridan (UKUP) 209 (0.7%) Chris Carter (Ind) 109 (0.4%) |
UUP 9,887 (32.1%, -0.5%) 2
seats DUP 7,245 (23.5%, +16.6%) 2 seats UKUP 3,583 (11.6%, -10.8%) 1 seat Best result for UKUP in Northern Ireland Inds 2,964 (9.6%, +6.0%) Alliance 2,655 (8.6%, -5.8%) 1 seat SDLP 1,519 (4.9%, -0.6%) NIWC 1,181 (3.8%, -1.0%) Green 730 (2.4%) Best result for Greens in Northern Ireland Cons 491 (1.6%, +0.7%) Best result for Conservatives in Northern Ireland PUP 316 (1.0%, -2.7%) SF 264 (0.9%) Electorate 57,422 |
Electorate: 63,212; votes cast: 37,377 (59.1%); spoilt votes: 188
(0.5%)
Valid votes: 37,189; UUP majority 7,324
* outgoing MP
@ member of the Assembly
This eagerly anticipated gain for the UUP was facilitated by the
decision of Alliance candidate Stephen Farry to withdraw from the
race in order to help defeat McCartney. If this had been a
six-seat Assembly election, the UUP would have won four and UKUP
two.
I received the news that McCartney had lost in a small radio
studio packed with guests of varying political hues, all of whom
were delighted. Danny Morrison commented that he had never thought
the day would come that he would be cheering on the wife of the
former Chief Constable of the RUC.
UUP 8883 (27%)
Alliance 5718 (18%)
DUP 4631 (14%)
UKUP 3034 (9%) Best equivalent result in Northern Ireland
PUP 1167 (4%)
NIWC 1166 (4%) Best equivalent result in Northern Ireland
Conservatives 551 (2%) Best equivalent result in Northern
Ireland
NIUP 188 (1%)
Independents 7159 (22%)
Including notional votes from Ards East would boost the UUP and DUP fractionally and diminish the votes for the others a little less. The UUP should win two seats in an STV election, and Alliance and the DUP one each. The last two are anybody's.
Also available: details of each count with
analysis of surplus transfers.
| *Robert
McCartney (UKU) 8,188 #Sir John Gorman (UUP) 4,719 *Alan McFarland (UUP) 4,653 #Eileen Bell (Alliance) 3,669 *Peter Weir (UUP) 2,775 Marietta Farrell (SDLP) 2,048 Jane Morrice (NIWC) 1,808 Gavin Walker (Alliance) 1,699 Alan Graham (DUP) 1,558 Alan Chambers (Ulster Ind) 1,382 Stewart Currie (PUP) 1,376 Brian Wilson (Ind) 1,327 *St Clair McAlister (DUP) 1,013 Leonard Fee (C) 337 Tom Lindsay (UDP) 265 Vanessa Baird-Gunning (Lab) 212 Elizabeth Roche (UKU) 173 Christopher Carter (Ulster's Independent Voice) 72 Andrea Gribben (NLP) 39 |
UUP 12,147
(32.55%) 3 seats Best result for UUP in Northern Ireland UKU 8,361 (22.41%) 1 seat Alliance 5,368 (14.39%) 1 seat DUP 2,571 (6.89%) SDLP 2,048 (5.49%) NIWC 1,808 (4.85%) 1 seat Ulster Ind 1,382 (3.70%) PUP 1,376 (3.69%) Ind 1,327 (3.56%) C 337 (0.90%) UDP 265 (0.71%) Lab 212 (0.57%) UIV 72 (0.19%) NLP 39 (0.10%) Electorate: 62,942 |
* elected in 1996 Forum/talks election from North Down
# elected in 1996 Forum/talks election as a 'top-up' candidate.
The poor performance of the DUP, as well as the success of the Women's Coalition and the UUP's third seat, were all major surprises here in perhaps the most volatile constituency in Northern Ireland. The SDLP's good performance was not enough to prevent them being eliminated; their transfers pulled Jane Morrice of the Women's Coalition ahead of the DUP. The last seat went to Peter Weir of the UUP, who finished with 4,751 votes to Alan Graham's 4,443 (Sir John Gorman's undistributed surplus of 15 votes would have slightly widened the gap.)
Ulster Unionist Party 5,273.6 (25%)
Alliance Party of Northern Ireland 4,460 (21%) Best equivalent
result for Alliance in Northern Ireland
Democratic Unionist Party 2,228.8 (11%)
United Kingdom Unionist Party 1,865.6 (9%)
Conservative Party 1,372 (7%)
Progressive Unionist Party 871 (4%)
Ulster Democratic Party 131 (1%)
Others 4,633 (22%)
Total valid 20,835 (33.19% of electorate)
Ulster Unionist Party (UUP) 9,270 (26%) 2 seats (Peter Weir, Alan
McFarland elected)
United Kingdom Unionist Party (UKUP) 7,579 (21%) 1 seat (Robert
McCartney elected)
Democratic Unionist Party (DUP) 6,699 (18%) 1 seat (St Clair
McAlister elected)
Alliance Party of Northern Ireland (APNI) 6,186 (17%) 1 seat (Sir
Oliver Napier elected)
Social Democratic and Labour Party (SDLP) 1,798 (5%)
Progressive Unionist Party (PUP) 1,694 (5%)
Ulster Democratic Party (UDP) 651 (2%)
Northern Ireland Women's Coalition (NIWC) 496 (1%)
Conservative Party (Con) 444 (1%)
Independent Chambers 334 (1%)
Green Party 283 (1%)
Sinn Féin (SF) 275 (1%)
Labour (Lab) 171 (0.47%)
Independent Democratic Unionist Party 97 (0.27%)
Democratic Left (DL) 95 (0.26%)
Workers Party (WP) 60 (0.17%)
Ulster Independence Movement (UIM) 49 (0.14%)
Ulster's Independent Voice (UIV) 49 (0.14%)
Natural Law Party (NLP) 15 (0.04%)
Electorate: 62,810; votes cast: 36,271 (57.7%); spoilt votes: 26 (0.0%); valid votes: 36,245
Napier had been elected to the 1973 Assembly, the 1975 Convention and the 1982 Assembly from East Belfast; McCartney was elected in 1982 for North Down.
| DUP | UKUP | UUP | Cons | Oth U | Alliance | NIWC | Green | Oth | SDLP | SF | |
| 2007a |
34% | 6% | 24% | 3% | 4% | 10% | 9% | 4% | 4% | 1% | |
| 2005w | 35% | 50% | 3% | 8% | 1% | 3% | 1% | ||||
| 2005lg | 34% | 2% | 23% | 1% | 2% | 15% | 2% | 8% | 10% | 2% | |
| 2003a | 23% | 12% | 32% | 2% | 5% | 9% | 4% | 2% | 10% | 5% | 1% |
| 2001w | 36% | 56% | 2% | 1% | 3% | 1% | |||||
| 2001lg* | 14% | 9% | 27% | 2% | 4% | 17% | 22% | ||||
| 1998a | 7% | 22% | 33% | 1% | 8% | 14% | 5% | 4% | 5% | ||
| 1997lg | 11% | 9% | 25% | 7% | 5% | 21% | 22% | ||||
| 1997w | 35% | 31% | 5% | 21% | 3% | 0% | 4% | ||||
| 1996f | 18% | 21% | 26% | 1% | 8% | 17% | 1% | 1% | 2% | 5% | 1% |
See also:Full 2003 results from North Down | Full 1998 results from North Down | The Boundary Commission's Provisional Recommendations | Boundary Commission 2003 | Jim Riley's analysis of votes and seats in the 1998 Assembly election | The constituencies
Other sites based at ARK: ORB (Online Research Bank) | CAIN (Conflict Archive on the INternet) | Northern Ireland Life and Times Survey
Your comments, please! Send an email to me at nicholas.whyte@gmail.com.
 |
This page has been developed with the support of a project grant from the New Initiatives Fund of the Electoral Commission. However, any views expressed on this page or, in particular, other pages of this website are those of the author and not necessarily shared by The Electoral Commission. |
Nicholas Whyte, 3 June 1998; last updated 7 May 2022 by Conal Kelly.
|
Disclaimer:� Nicholas Whyte 1998-2015
|