

| |
|
|
|
|
|
|
 |
| Map and graph by Conal Kelly |
|
This constituency takes in the eastern quarter of Belfast City Council and the northern end
of Lisburn and Castlereagh District Council.
The member of parliament has been Gavin Robinson (DUP) since 2015;
he defeated Naomi Long (Alliance), who had herself defeated Peter
Robinson (DUP, not related to Gavin) in 2010; he had defeated Bill
Craig, the former Vanguard leader who had then joined the UUP, in
1979. The Alliance hold two Assembly seats, the DUP two and the
UUP one. See also 1983-1992 East Belfast
results, 1973-82 East Belfast results
and 1950-70 East Belfast results.
The boundary changes were very straightforward, with a loss to
North Down in one direction and gains from South Belfast in the
other. This does bring in notional South Belfast SDLP votes (the
SDLP did not stand in East Belfast in 2019).
DUP 21,616 (47.9%)
Alliance 18,990 (42.1%)
UUP 2,581 (5.7%)
SDLP 1,939 (4.3%)
| DUP | UUP | Alliance | SDLP | ||
| 2019 actual |
20,874 | 2,516 | 19,055 | ||
| 49.2% | 5.9% | 44.9% | 0.0% | ||
| From East Belfast |
To East Belfast | 19,726 | 2,378 | 18,232 | |
| From East Belfast | To North Down |
-1148 | -138 | -823 | |
| From South Belfast | To East Belfast | 1,890 | 204 | 758 | 1939 |
| 2019 notional |
21,616 | 2,581 | 18,990 | 1939 | |
| 47.9% | 5.7% | 42.1% | 4.3% | ||
| -1.3% | -0.2% | -2.8% | 4.3% |
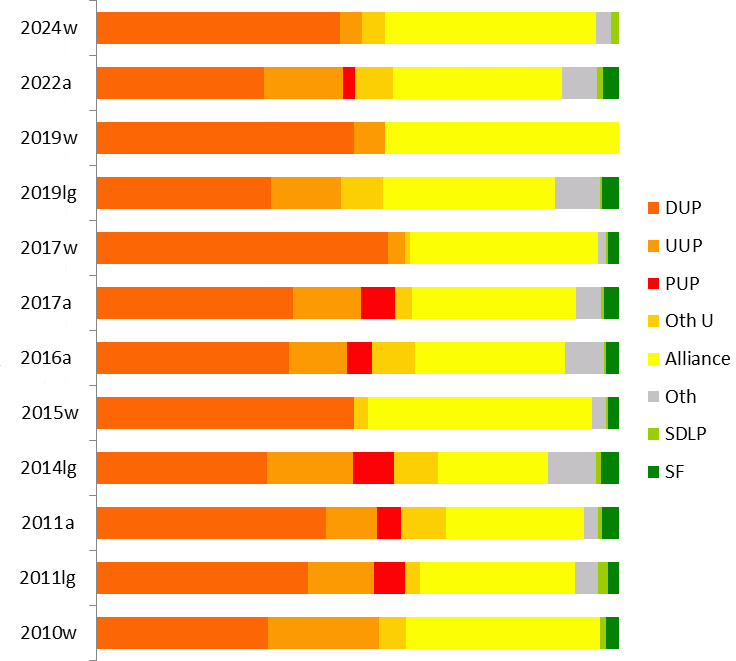
| DUP | UUP | PUP | Oth U | Alliance | Oth | SDLP | SF | |
| 2024w |
46.6% |
4.3% |
4.5% |
40.3% |
2.9% |
1.5% |
||
| 2022a |
32.1% | 15.2% | 2.2% | 7.1% | 32.4% | 6.6% | 1.1% | 3.2% |
| 2019w |
49.2% | 5.9% | |
|
44.9% | |
|
|
| 2019lg |
33.4% | 13.4% | 4.8% | 3.3% | 33.0% | 8.6% | 0.4% | 3.3% |
| 2017w |
55.8% | 3.3% | 1.0% | 36.0% | 1.4% | 0.4% | 2.1% | |
| 2017a |
37.6% | 13.1% | 6.6% | 3.0% | 31.4% | 4.9% | 0.6% | 2.9% |
| 2016a |
36.7% | 11.1% | 4.8% | 4.1% | 28.7% | 11.7% | 0.4% | 2.5% |
| 2015w | 49.3% | 2.8% | 42.8% | 2.7% | 0.3% | 2.1% | ||
| 2014lg |
32.7% | 16.4% | 7.8% | 8.5% | 20.9% | 9.3% | 0.9% | 3.4% |
| 2011a | 44.0% | 9.7% | 4.6% | 8.5% | 26.3% | 2.7% | 0.8% | 3.2% |
| 2011lg | 40.5% | 12.6% | 5.9% | 2.9% | 29.7% | 4.4% | 1.8% | 2.1% |
| 2010w | 32.8% | 21.2% | 5.2% | 37.2% | 1.1% | 2.4% | ||
| 2007a | 41.5% | 22.0% | 9.8% | 17.4% | 4.6% | 2.2% | 2.6% | |
| 2005w | 52.4% | 29.5% | 11.1% | 2.5% | 2.1% | 2.4% | ||
| 2005lg | 45.9% | 24.6% | 4.9% | 1.5% | 16.0% | 1.7% | 3.0% | 2.4% |
NB that the figures for elections before 2010 are projections.
Figures for the previous boundaries can be found at the bottom of
this page.
NB also that the Conservatives supported the UUP candidate(s) in
2010 and 2011.
| @Naomi Long (Alliance) 8,195 (18.9%) @Joanne Bunting (DUP) 7,253 (16.8%) David Brooks (DUP) 6,633 (15.3%) Peter McReynolds (Alliance) 5,820 (13.5%) @Andy Allen (UUP) 5,281 (12.2%) John Ross (TUV) 3,087 (7.1%) Brian Smyth (Green) 2,302 (5.3%) Mairéad O'Donnell (SF) 1,369 (3.2%) Lauren Kerr (UUP) 1,282 (3.0%) Karl Bennett (PUP) 970 (2.2%) Hannah Kenny (PBP) 500 (1.2%) Charlotte Carson (SDLP) 484 (1.1%) Eoin MacNeill (WP) 72 (0.2%) |
Alliance 14,015 (32.4%, +1.0%) 2 seats
DUP 13,886 (32.1%, -5.5%) 2 seats UUP 6,563 (15.2%, +2.1%) 1 seat TUV 3,087 (7.1%, +4.8%) Green 2,302 (5.3%, +1.7%) SF 1,369 (3.2%, -0.3%) PUP 970 (2.2%, -4.4%) PBP 500 (1.2%) SDLP 484 (1.1%, +0.5%) WP 72 (0.2%) Electorate: 70,123 Votes cast: 43,840 (62.5%), spoilt votes 592 (1.4%) Valid votes: 43,248, quota 7,209 |
No change in East Belfast. A Green challenge for the UUP seat
fell significantly short, with the UUP's Andy Allen some 3988.96
votes ahead of the Green's Brian Smyth on the final count, and
well over 2,000 Unionist surplus votes undistributed. This was
Alliance's best result of the election, securing 32.4% of the
first preferences, an increase of 1% over 2017.
*Gavin Robinson (DUP) 20,874 (49.2%, +6.6%)
^Naomi Long (Alliance) 19,055 (44.9%, +8.9%)
Carl McClean (UUP) 2,516 (5.9%, +2.6%)
* outgoing MP.
^ member of the European Parliament.
Electorate: 66,245; Total Poll: 42,619 (64.3%); Invalid Votes:
174 (0.4%); Valid Votes: 42,445
In one of the closest results of the election, Gavin Robinson
will have been relieved to have kept his seat. Alliance benefited
somewhat from other parties not standing, but also from some
direct vote switches from the DUP. This is Alliance's second
highest ever vote share in a Westminster election (the highest
being Stephen Farry's total in North Down). In a five-seat
Assembly election, these votes would give the DUP three seats and
Alliance two.
From the 2011 census, East Belfast includes:
99% of the Belfast DEA of Ormiston
83% of the Belfast DEA of Titanic
45% of the Belfast DEA of Lisnasharragh
and
85% of the Lisburn and Castlereagh DEA of Castlereagh East.
With some adjustment for voter community background, I project
the 2019 results as:
DUP 10,654 (33.4%)
Alliance 10,510 (33.0%)
UUP 4,261 (13.4%)
Green 2,371 (7.4%)
PUP 1,468 (4.6%)
SF 1,039 (3.3%)
TUV 538 (1.7%)
UKIP 511 (1.6%)
Inds 260 (0.8%)
SDLP 134 (0.4%)
CCLA 72 (0.2%)
PBP 60 (0.2%)
If cast in a five-seat STV election, those votes would give the DUP and Alliance two seats each, and the UUP one.
*Gavin Robinson (DUP) 23,917 (55.8%, +5.5%)
@Naomi Long (Alliance) 15,443 (36.0%, -6.8%)
Hazel Legge (UUP) 1,408 (3.3%)
Mairéad O'Donnell (SF) 894 (2.1%, ±0)
Georgina Milne (Green) 561 (1.3%, -1.4%)
Sheila Bodel (Cons) 446 (1.0%, -1.8%)
Séamas de Faoite (SDLP) 167 (0.4%, +0.1%)
Bobby Beck (Ind) 54 (0.1%)
* outgoing MP.
@ member of the Assembly
Electorate: 63,495; Total Poll: 42,890 (67.7%); Invalid Votes:
93 (0.2%); Valid Votes: 42,994
Gavin Robinson kept his seat pretty comfortably. In a five-seat
Assembly election, these votes would give the DUP three seats and
Alliance two.
| @Naomi Long (Alliance) 7,610
(18.9%) @Joanne Bunting (DUP) 6,007 (14.9%) @Andy Allen (UUP) 5,275 (13.1%) @Chris Lyttle (Alliance) 5,059 (12.5%) @Robin Newton (DUP) 4,729 (11.7%) David Douglas (DUP) 4,431 (11.0%) John Kyle (PUP) 2,658 (6.6%) Georgina Milne (Green) 1,447 (3.6%) Mairéad O'Donnell (SF) 1,173 (2.9%) Andrew Girvin (TUV) 917 (2.3%) Courtney Robinson (Cross Community Labour Alternative) 442 (1.1%) Sheila Bodel (Conservative) 275 (0.7%) Séamas de Faoite (SDLP) 250 (0.6%) Jordy McKeag (Independent) 84 (0.2%) |
DUP 15,167 (37.6%, +0.9%) 2 seats (-1) Alliance 12,669 (31.4%, +2.7%) 2 seats UUP 5,275 (13.1%, +2.0%) 1 seat PUP 2,658 (6.6%, +1.8%) Green 1,447 (3.6%, -2.3%) SF 1,173 (2.9%, +0.4%) TUV 917 (2.3%, -0.1%) CCLA 442 (1.1%, -0.3%) Cons 275 (0.7%, -0.6%) SDLP 250 (0.6%, +0.2%) Ind 84 (0.2%) Electorate 64,788 Votes cast 40,828 (63.0%); spoilt 471 (1.2%) Valid votes 40,357; quota 6,727 |
The five incumbent MLAs standing for re-election were all
returned, David Douglas of the DUP battling it out with
running-mate Robin Newton for the last seat and eventually losing
by 130.81 votes. The closest runner from any other party was John
Kyle of the PUP, who was 1450.94 votes behind Douglas and 1741.93
behind Newton when eliminated several rounds earlier.
| Joanne Bunting (DUP) 5,538 Naomi Long (Alliance) 5,482 @Sammy Douglas (DUP) 4,230 @Robin Newton (DUP) 3,875 @Andy Allen (UUP) 3,047 @Chris Lyttle (Alliance) 2,805 Tim Morrow (Alliance) 2,372 Ross Brown (Green) 2,183 John Kyle (PUP) 1,772 Maggie Hutton (Ind) 1,099 Chris McGimpsey (UUP) 1,095 Niall Ó Donnghaile (Sinn Féin) 946 Andrew Girvin (TUV) 887 Jonny Lavery (UKIP) 631 Courtney Robinson (CCLA) 517 Neil Wilson (Cons) 477 Amy Doherty (SDLP) 141 Erskine Holmes (NILRC) 78 |
DUP 13,643 (36.7%, -7.3%) 3 seats Alliance 10,659 (28.7%, +2.4%) 2 seats UUP 4,142 (11.1%, +1.4%) 1 seat Green 2,183 (5.9%, +4.1%) PUP 1,772 (4.8%, +0.2%) Ind 1,099 (3.0%) SF 946 (2.5%, -0.7%) TUV 887 (2.4%, +0.2%) UKIP 631 (1.7%) CCLA 517 (1.4%) Cons 477 (1.3%) SDLP 141 (0.4%, -0.4%) NILRC 78 (0.2%) Electorate 65,740 Votes cast 37,623 (57.2%, +3.6%), spoilt votes 448 (1.2%) Valid votes 37,175; quota 5,311 |
No change here with Ross Brown (Green) 1324.85 votes behind Robin
Newton (DUP) on the last count.
Gavin Robinson (DUP) 19,575 (49.3%, +16.5%)
*Naomi Long (Alliance) 16,978 (42.8%, +5.6%)
Neil Wilson (Conservative) 1,121 (2.8%, +2.8%)
Ross Brown (Green) 1,058 (2.7%)
Niall Ó Donnghaile (SF) 823 (2.1%, -0.3%)
Mary Muldoon (SDLP) 127 (0.3%, -0.7%)
Electorate: 63,157; Total Poll: 39,860 (63.1%); Invalid Votes: 178
(0.4%); Valid Votes: 39,682
Given that the DUP were supported also by the UUP and TUV, this
was always going to be a difficult defence for Long, who none the
less got the best percentage share that Alliance has ever got in a
parliamentary election. The squeeze of smaller candidates is
noteworthy.
If cast in a six-seat Assembly election, these votes would give
both the DUP and Alliance three seats.
From the 2011 census, East Belfast includes:
99% of the Belfast DEA of Ormiston
83% of the Belfast DEA of Titanic
45% of the Belfast DEA of Lisnasharragh
and
85% of the Lisburn and Castlereagh DEA of Castlereagh East.
With some adjustment for voter community background, I project
the 2014 results as:
DUP 10,334 (33%)
Alliance 6607 (21%)
UUP 5184 (16%)
PUP 2468 (8%)
TUV 1694 (5%)
Green 1592 (5%)
SF 1084 (3%)
NI21 1060 (3%)
UKIP 816 (3%)
SDLP 294 (1%)
Cons 160 (1%)
Inds 116 (0.4%)
Soc 89 (0.3%)
WP 58 (0.2%)
If cast in a six-seat STV election, those votes would give the
DUP and Alliance two seats for sure, and the UUP one; the last
seat would be between the third DUP candidate and a minor Unionist
party (most likely the PUP).
|
@Peter Robinson (DUP)
9,149 (28.3%) @ member of the Assembly when it was dissolved. |
DUP 14253 (44.0%, +6.4%) 3 seats Alliance 8512 (26.3%, +7.5%) 2 seats (+1) UUP 3137 (9.7%, -12.3%) 1 seat Purvis 1702 (5.3%) PUP 1493 (4.6%, -5.7%) (-1 seat) SF 1030 (3.2%, -0.4%) TUV 712 (2.2%) Green 572 (1.8%, -0.4%) BNP 337 (1.0%) SDLP 250 (0.8%, -2.0%) Socialist 201 (0.6%, -0.2%) WP 102 (0.3%, -0.1%) Electorate 61,263 Votes cast 32,828 (53.6%), spoilt votes 481 (1.5%) Valid votes 32,347; quota 4,622 |
@Naomi Long (Alliance) 12,839 (37.2%, +26.1%)
*@Peter Robinson (DUP) 11,306 (32.8%, -19.6%)
Trevor Ringland (UCUNF) 7,305 (21.2%, -9.7%)
David Vance (TUV) 1,856 (5.4%)
Niall Ó Donnghaile (Sinn Féin) 817 (2.4%, ±0)
Mary Muldoon (SDLP) 365 (1.1%, -1.0%)
Electorate: 59,007; Total Poll: 34,612 (58.7%); Invalid Votes: 124
(0.4%); Valid Votes: 34,488
* incumbent
@ elected to the Northern Ireland Assembly from this constituency
The surprise result of the election, and the only seat to change both party and MP. In a generally duff year for the DUP, Robinson did particularly badly; Long doubled her vote from the 2007 Assembly election, and more than tripled it from Alliance's 2005 total. These votes, if cast in an Assembly election, would give Alliance and the DUP two seats, and the UUP one, with the last seat between a third Alliance candidate and a second UUP candidate.
| *Peter Robinson MP (DUP)
5635 (19.0%) *Naomi Long (Alliance) 5583 (18.8%) *[Sir] Reg Empey (UUP) 4139 (14.0%) Wallace [Lord] Browne (DUP) 3185 (10.7%) +Dawn Purvis (PUP) 3045 (10.3%) *Robin Newton (DUP) 2335 (7.9%) *Michael Copeland (UUP) 1557 (5.3%) Niall Ó Donnghaile (SF) 1055 (3.6%) Jim Rodgers (UUP) 820 (2.8%) Mary Muldoon (SDLP) 816 (2.8%) Stephen Agnew (Green) 653 (2.2%) Glyn Chambers (Conservative) 427 (1.4%) Thomas Black (Socialist Party) 225 (0.8%) Joe Bell (Workers Party) 107 (0.4%) Rainbow George (Make Politicians History) 47 (0.2%) *Elected in 2003 from East Belfast +Appointed to 2003-07 Assembly to fill a vacancy |
DUP 11,155 (37.6%, -1.5%) 3 seats (+1) UUP 6,516 (22.0%, -11.1%) 1 seat (-1) Alliance 5,583 (18.8%, +9.9%) 1 seat PUP 3,045 (10.3%, +0.6%) 1 seat SF 1,055 (3.6%, -0.3%) SDLP 816 (2.8%, -0.4%) Green 653 (2.2%) Conservative 427 (1.4%, +0.7%) Socialist 225 (0.8%, +0.2%) WP 107 (0.4%, -0.04%) Rainbow George 47 (0.2%, -0.1%) Electorate 49,757 Votes cast 29,873 (60.0%); spoilt votes 242 (0.8%) Valid votes 29,629; quota 4,233 |
*@Peter Robinson (DUP) 15,152 (49.1% +6.6%)
@Sir Reg Empey (UUP) 9,275 (30.1% +6.9%)
@Naomi Long (Alliance) 3,746 (12.2% -3.6%)
Deborah Devenny (Sinn Fein) 1,029 (3.3% -0.1%)
Mary Muldoon (SDLP) 844 (2.7% +0.3%)
Alan Greer (Conservative) 434 (1.4% -0.8%)
Joe Bell (WP) 179 (0.6% +0.3%)
Lynda Gilby (Vote for Yourself Rainbow Dream Ticket) 172 (0.6%
+0.4%)
* outgoing MP
@Member of the Assembly
No big surprise. These votes, if cast in a six-seat STV election, would probably have given the DUP three seats, the UUP two and Alliance one.
DUP 13080.7 (43.0%)
UUP 7674.9 (25.2%)
Alliance 5319.8 (17.5%) - Best equivalent result for Alliance
in Northern Ireland
PUP 1481.4 (4.9%) - Best equivalent result for the PUP in
Northern Ireland
SDLP 1396.7 (4.6%)
Sinn Fein 629.3 (2.1%)
Independents 419.6 (1.4%)
Conservative 243 (0.8%)
Socialist Party 108.7 (0.4%)
WP 70 (0.2%)
Extrapolating from the local government elections is very difficult because the East Belfast constituency breaches three local electoral area boundaries. If we make some reasonable adjustments, we get these figures for the whole constituency. The DUP would have won three seats on these votes, the UUP two, and Alliance one.
| *Peter
Robinson (DUP) 9254 (29.9%) *Sir Reg Empey (UUP) 6459 (20.9%) *David Ervine (PUP) 2990 (9.7%) Naomi Long (Alliance) 2774 (9.0%) Michael Copeland (UUP) 2291 (7.4%) Jim Rodgers (UUP) 1502 (4.9%) Robin Newton (DUP) 1475 (4.8%) Harry Toan (DUP) 1403 (4.5%) Joseph O'Donnell (SF) 1180 (3.8%) Leo Van Es (SDLP) 967 (3.1%) Terry Dick (Cons) 232 (0.7%) Thomas Black (Soc) 176 (0.6%) Joseph Bell (WP) 125 (0.4%) John McBlain (Ind) 72 (0.2%) Rainbow George Weiss (VFYS) 65 (0.2%) |
DUP 12,132 (39.2%, +7.8%) 2
seats UUP 10,252 (33.1%, +8.8%) 2 seats PUP 2,990 (9.7%, -3.9%) 1 seat Best result for PUP in Northern Ireland Alliance 2,774 (9.0%, -9.0%) 1 seat SF 1,180 (3.8%, +1.5%) SDLP 967 (3.1%, +0.5%) Con 232 (0.7%, +0.2%) Soc 176 (0.6%) Best result for Socialists in Northern Ireland WP 125 (0.4%, +0.2%) Ind 72 (0.2%) VFYS 65 (0.2%) Best result for Vote For Yourself Party in Northern Ireland Electorate 51,937 |
Electorate: 58,455; votes cast: 37,031 (63.3%); spoilt votes: 202
(0.5%)
Valid votes: 36,829; DUP majority 7,117
* outgoing MP
@Member of the Assembly
Not a very surprising result, indeed quite a close reproduction of 1997. Even a single pro-Agreement candidate running against Robinson would have had difficulties. If this had been a six-seat Assembly election, the DUP would have won three, and Alliance and the UUP one each, with the PUP probably beating the UUP for the last seat.
DUP 12970.7 (36%)
UUP 10541.8 (29%)
Alliance 5683 (16%)
PUP 2534.7 (7%)
SDLP 1277.2 (4%)
SF 874.3 (2%)
Conservative Party 365 (1%)
UKUP 338.3 (1%)
Workers Party 86 (0.2%)
Women's Coalition 61.2 (0.2%)
Independents 1506.0 (4%)
Total valid 36238.2
Extrapolating from the these figures , the DUP and UUP would both have won two seats, and Alliance one. The last seat would have been between a third DUP candidate and the PUP.
| *Peter Robinson MP (DUP) 11,219 *Lord Alderdice (Alliance) 6,144 *Reg Empey (UUP) 5,158 #David Ervine (PUP) 5,114 Ian Adamson (UUP) 3,447 Denny Vitty (UKU) 1,362 Peter Jones (SDLP) 1,025 *Jim Rodgers (UUP) 1,015 Richard Good (Alliance) 1,000 Joe O'Donnell (SF) 917 #Pearl Sagar (NIWC) 711 *Sammy Wilson (DUP) 633 Robert Girvan (UDP) 516 John Norris (DUP) 373 David Bleakley (Lab) 369 Dawn Purvis (PUP) 271 Lesley Donaldson (C) 203 Joe Bell (WP) 79 David Collins (NLP) 22 John Lawrence (Energy 106 Party) 15 |
DUP 12,225 (30.88%) 2 seats
UUP 9,620 (24.30%) 2 seats Alliance 7,144 (18.04%) 1 seat PUP 5,385 (13.60%) 1 seat UKU 1,362 (3.44%) SDLP 1,025 (2.59%) SF 917 (2.32%) NIWC 711 (1.80%) UDP 516 (1.30%) Lab 369 (0.93%) C 203 (0.51%) WP 79 (0.20%) NLP 22 (0.06%) Energy 15 (0.04%) Electorate 60,562 |
* elected in 1996 Forum/talks election from East Belfast
# elected in 1996 Forum/talks election as a 'top-up' candidate.
Not a great surprise. Richard Good (Alliance), who finished on 2,975, was a long way behind Ian Adamson (UUP) on 5,414.
Democratic Unionist Party 10177.8 (36%) (best equivalent
result for DUP in NI)
Ulster Unionist Party 8054.3 (28%)
Alliance Party of Northern Ireland 5804 (20%)
Progressive Unionist Party 1654.7 (6%)
Sinn Féin 652 (2%)
Social Democratic and Labour Party 553.8 (2%)
United Kingdom Unionist Pary 267 (1%)
Conservative Party 256 (1%)
Ulster Democratic Party 199.2 (1%)
Women's Coalition 99.3 (0.35%)
Workers Party 76.7 (0.27%)
Natural Law Party 37.7 (0.13%)
Ulster Independence 14 (0.05%)
East Belfast Labour 12.7 (0.04%)
Others 259.7 (1%)
Total valid 28,399.3 (45.18% of electorate)
* outgoing MP
ƒ Member of the Forum
Democratic Unionist Party (DUP) 11,270 (29%); Peter Robinson,
Sammy Wilson elected
Ulster Unionist Party (UUP) 8,608 (22%); Reg Empey, Jim Rodgers
elected
Alliance Party of Northern Ireland (APNI) 7,130 (19%); John
Alderdice elected (best result for Alliance in NI)
Progressive Unionist Party (PUP) 3,802 (10%)
United Kingdom Unionist Party (UKU) 2,496 (7%)
Social Democratic and Labour Party (SDLP) 1,299 (3%)
Ulster Democratic Party (UDP) 1,156 (3%)
Sinn Féin (SF) 862 (2%)
Northern Ireland Women's Coalition (NIWC) 405 (1%)
Conservative Party (Con) 291 (1%)
Labour (Lab) 199 (1%)
Democratic Partnership 197 (1%)
Green Party 161 (0.42%)
Workers Party (WP) 149 (0.39%)
Ulster Independence Movement (UIM) 114 (0.30%)
Independent Democratic Unionist Party 93 (0.24%)
Democratic Left (DL) 45 (0.12%)
Communist Party of Ireland (CP) 38 (0.10%)
Natural Law Party (NLP) 13 (0.03%)
Independent Chambers 11 (0.03%)
Electorate: 62,161; votes cast: 38,419 (61.8%); spoilt votes: 80 (0.2%); valid votes: 38,339
Peter Robinson had previously been elected to the 1982 Assembly, and Reg Empey to the 1975 Constitutional Convention, from East Belfast.
| DUP | UKUP | UUP | PUP | Oth U | Alliance | Oth | SDLP | SF | |
| 2007a | 38% | 22% | 10% | 1% | 19% | 3% | 3% | 4% | |
| 2005w | 49% | 30% | 1% | 12% | 1% | 3% | 3% | ||
| 2005lg | 43% | 25% | 5% | 1% | 17% | 2% | 5% | 2% | |
| 2003a | 39% | 33% | 10% | 1% | 9% | 1% | 3% | 4% | |
| 2001w | 43% | 23% | 10% | 2% | 16% | 1% | 2% | 3% | |
| 2001lg | 36% | 1% | 29% | 7% | 1% | 16% | 4% | 4% | 3% |
| 1998a | 31% | 3% | 24% | 14% | 2% | 18% | 3% | 3% | 2% |
| 1997lg | 36% | 1% | 28% | 6% | 3% | 20% | 2% | 2% | 2% |
| 1997w | 42% | 25% | 2% | 24% | 2% | 2% | 2% | ||
| 1996f | 29% | 7% | 22% | 10% | 4% | 19% | 3% | 3% | 2% |
See also: Full 2003 results from East Belfast | Full 1998 results from East Belfast | The Boundary Commission's Provisional Recommendations | Boundary Commission 2003 | Jim Riley's analysis of votes and seats in the 1998 Assembly election | The constituencies
Other sites based at ARK: ORB (Online Research Bank) | CAIN (Conflict Archive on the INternet) | Northern Ireland Life and Times Survey
Your comments, please! Send an email to me at nicholas.whyte@gmail.com.
 |
This page has been developed with the support of a project grant from the New Initiatives Fund of the Electoral Commission. However, any views expressed on this page or, in particular, other pages of this website are those of the author and not necessarily shared by The Electoral Commission. |
Nicholas Whyte, 3 June 1998; last updated 7 May 2022 by Conal Kelly.
|
|
Disclaimer:� Nicholas Whyte 1998-2015
|