

| |
|
|
|
|
|
|
 |
| Map and graph by Conal Kelly | |
This constituency includes the northern part of Derry and Strabane District Council. The MP
since 2019 is Colum Eastwood (SDLP Leader), who defeated Elisha
McCallion (Sinn Féin). McCallion, elected in 2017, had defeated
Mark Durkan (SDLP). He had taken over in 2005 from his predecessor
as party leader, John Hume, who had represented the constituency
since it was created in 1983. SF and the
SDLP each hold two of the fifth Assembly seats here, and the DUP
have the other. See the 1983-92 Foyle results.
| DUP | UUP | Alliance | PBP | SDLP | SF | Aontu | ||
| 2019 actual |
4,773 | 1,088 | 1,267 | 1,332 | 26,881 | 9,771 | 2,032 | |
| 10.1% | 2.3% | 2.7% | 2.8% | 57.0% | 20.7% | 4.3% | ||
| From Foyle |
To Foyle |
3,852 | 878 | 1189 | 1,251 | 25,785 | 9,372 | 1949 |
| From Foyle | To East Londonderry |
-691 | -157 | -49 | -51 | -591 | -215 | -45 |
| From Foyle | To West Tyrone |
-230 | -53 | -29 | -30 | -505 | -184 | -38 |
| 2019 notional |
3,852 | 878 | 1,189 | 1,251 | 25,785 | 9,372 | 1,949 | |
| 8.7% | 2.0% | 2.7% | 2.8% | 58.2% | 21.2% | 4.4% | ||
| -1.4% | -0.3% | 0.0% | 0.0% | 1.2% | 0.4% | 0.1% |
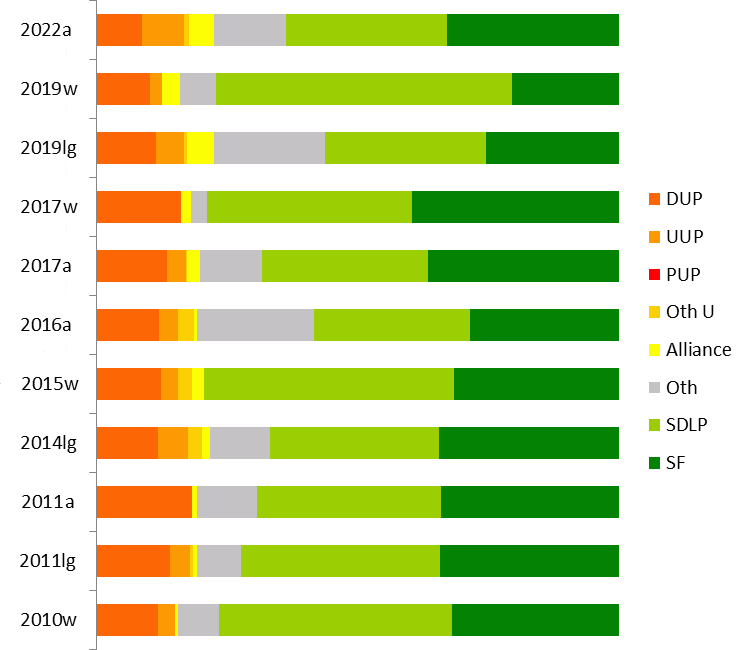
| DUP | UUP | Oth U | Alliance | PBPA | Oth | SDLP | SF | |
| 2024w |
10.2% |
3.7% |
3.3% |
6.4% |
5.7% |
40.8% |
29.9% |
|
| 2022a |
8.8% | 8.0% | 1.1% | 4.7% | 5.6% | 8.2% | 30.9% | 32.8% |
| 2019w | 10.1% | 2.3% | 2.7% | 2.8% | 4.3% | 57.0% | 20.7% | |
| 2019lg |
11.4% | 5.3% | 5.2% | 9.0% | 12.3% | 30.8% | 26.0% | |
| 2017w | 16.1% | 1.8% | 3.0% | 39.3% | 39.7% | |||
| 2017a |
13.4% | 3.7% | 0.2% | 2.5% | 10.7% | 1.1% | 31.8% | 36.6% |
| 2016a |
11.9% | 3.6% | 3.0% | 0.6% | 10.5% | 10.9% | 30.0% | 28.5% |
| 2015w |
12.4% | 3.3% | 2.6% | 2.3% | 47.9% | 31.6% | ||
| 2014lg |
11.9% | 5.7% | 2.7% | 1.5% | 11.4% | 32.3% | 34.4% | |
| 2011a | 18.4% | 0.9% | 8.0% |
3.5% | 35.3% | 34.0% | ||
| 2011lg |
14.2% | 3.8% | 0.5% | 0.9% | 3.3% |
5.1% | 38.0% | 34.2% |
| 2010w | 11.9% | 3.2% | 0.6% | 7.8% | 44.7% | 31.9% | ||
| 2007a |
16.6% | 4.2% | 0.2% | 0.6% | 5.0% |
5.5% | 37.1% | 30.9% |
| 2005w | 14.1% | 2.3% | 3.6% |
0.1% | 46.4% | 33.3% | ||
| 2005lg | 15.7% | 4.2% | 2.9% |
3.1% | 40.7% | 33.3% |
| @Pádraig Delargy (SF) 9,471 (20.2%) @Mark H. Durkan (SDLP) 7,999 (17.1%) @Ciara Ferguson (SF) 5,913 (12.6%) @Gary Middleton (DUP) 4,101 (8.8%) Ryan McCready (UUP) 3,744 (8.0%) Brian Tierney (SDLP) 3,272 (7.0%) @Sinead McLaughlin (SDLP) 3,189 (6.8%) Shaun Harkin (PBP) 2,621 (5.6%) Rachael Ferguson (Alliance) 2,220 (4.7%) Emmet Doyle (Aontú) 2,000 (4.3%) Anne McCloskey (Ind) 854 (1.8%) Colly McLaughlin (IRSP) 766 (1.6%) Elizabeth Neely (TUV) 499 (1.1%) Gillian Hamilton (Green) 215 (0.5%) @ member of the Assembly when it was dissolved |
SF 15,384 (32.8%, -3.8%) 2 seats SDLP 14,460 (30.9%, -0.9%) 2 seats DUP 4,101 (8.8%, -4.6%) 1 seat UUP 3,744 (8.0%, +4.3%) PBP 2,621 (5.6%, -5.1%) Alliance 2,220 (4.7%, +2.2%) Aontú 2,000 (4.3%) Ind 854 (1.8%) IRSP 766 (1.6%) TUV 499 (1.1%) Green 215 (0.5%, ±0%) Electorate: 77,343 Votes cast: 47,674 (61.6%, -3.4%), spoilt votes 810 (1.7%) Valid votes: 46,864, quota 7,811 |
@Colum Eastwood (SDLP) 26,881 (57.%, +17.7%)
*Elisha McCallion (SF) 9,771 (20.7%, -19.%)
@Gary Middleton (DUP) 4,773 (10.1%, -6.0%)
Anne McCloskey (Aontú) 2,032 (4.3%, +4.3%)
Shaun Harkin (PBP) 1,332 (2.8%, -0.2%)
Rachael Ferguson (Alliance) 1,267 (2.7%, +0.8%)
Darren Guy (UUP) 1,088 (2.3%, +2.3%)
* outgoing MP.
@ member of the Assembly.
Electorate: 74,346; Total Poll: 47,370 (63.7%); Invalid Votes:
226 (0.5%); Valid Votes: 47,144
One of the SDLP's two gains in the election. SF vote almost
halved compared to 2017. Local elections had indicated slippage
here, but not this much. SDLP also clearly ate into Unionist vote.
In a five-seat Assembly election, these votes would give the SDLP
three seats, Sinn Fein one, and the DUP best placed for the last.
From the 2011 census, Foyle includes:
The entire Derry and Strabane DEA of Ballyarnett
@Elisha McCallion (SF) 18,256 (39.7%, +8.1%)
*Mark Durkan (SDLP) 18,087 (39.3%, +8.6%)
@Gary Middleton (DUP) 7,398 (16.1%, +4.2%)
Shaun Harkin (PBP) 1,377 (3.0%)
John Doherty (Alliance) 847 (1.8%, -0.5%)
* outgoing MP.
@ member of the Assembly
Electorate: 70,324; Total Poll: 46,136
(65.6%); Invalid Votes: 177 (0.4%); Valid Votes: 45,965
What had been the SDLP's safest seat
fell to SF by a margin of 169 votes, the closest result in
Northern Ireland. In a five-seat Assembly election, these votes
would give SF and the SDLP two seats each, and the DUP one.
| Elisha Mccallion (SF) 9,205 (20.6%) @Colum Eastwood (SDLP) 7,240 (16.2%) @Raymond Mccartney (SF) 7,145 (16.0%) @Mark Durkan (SDLP) 6,948 (15.6%) @Gary Middleton (DUP) 5,975 (13.4%) @Eamonn McCann (PBP) 4,760 (10.7%) Julia Kee (UUP) 1,660 (3.7%) Colm Cavanagh (Alliance) 1,124 (2.5%) Shannon Downey (Green) 242 (0.5%) John Lindsay (CISTA) 196 (0.4%) Stuart Canning (Con) 77 (0.2%) Arthur Mcguinness (Ind) 44 (0.1%) @ member of the Assembly for
Foyle when it was dissolved |
SF 16,350 (36.6%, +8.1%) 2 seats SDLP 14,188 (31.8%, +1.8%) 2 seats DUP 5,975 (13.4%, +1.5%) 1 seat PBP 4,760 (10.7%, +0.2%) 0 seats (-1) UUP 1,660 (3.7%, +0.1%) Alliance 1,124 (2.5%, +1.9%) Green 242 (0.5%, +0.1%) CISTA 196 (0.4%, -0.3%) Con 77 (0.2%, +0.1%) Ind 44 (0.1%) Electorate: 69,718 Votes cast: 45,317 (65.0%, +9.0%), spoilt votes 701 (1.5%) Valid votes: 44,616, quota 7,437 |
| %Martin McGuinness (Sinn Féin) 5,037 (12.7%) @Colum Eastwood (SDLP) 5,000 (12.6%) @Gary Middleton (DUP) 4,737 (11.9%) @Mark H. Durkan (SDLP) 4,197 (10.6%) Eamonn McCann (People Before Profit) 4,176 (10.5%) Anne McCloskey (Independent) 3,410 (8.6%) @Raymond McCartney (Sinn Féin) 3,198 (8.1%) Maeve McLaughlin (Sinn Féin) 3,062 (7.7%) @Gerard Diver (SDLP) 2,700 (6.8%) Julia Kee (UUP) 1,420 (3.6%) Maurice Devenney (Independent) 1,173 (3.0%) Kathleen Bradley (Independent) 902 (2.3%) John Lindsay (CISTA) 259 (0.7%) Chris McCaw (Alliance) 238 (0.6%) Mary Hassan (Green) 157 (0.4%) Alan Dunlop (Conservative) 36 (0.1%) @ member of the Assembly for
Foyle when it was dissolved |
SDLP 11897 (30.0%, -5.3%) 2 seats (-1) Sinn Féin 11297 (28.5%, -5.5%) 2 seats Independents 5485 (13.9%) DUP 4737 (11.9%, -6.5%) 1 seat People Before Profit 4176 (10.5%, +2.5%) 1 seat (+1) UUP 1420 (3.6%) CISTA 259 (0.7%) Alliance 238 (0.6%, -0.3%) Green 157 (0.4%) Conservative 36 (0.1%) Electorate 71,759 Turnout 40,187 (56.0%); spoilt votes 485 (1.2%) Valid votes 39,702; quota 5,672 |
*Mark Durkan (SDLP) 17,725 (47.9%, +3.2%)
Gearóid Ó Heára (SF) 11,679 (31.6%, -0.4%)
Gary Middleton (DUP) 4,573 (12.4%, +0.5%)
Julia Kee (UUP) 1,226 (3.3%, +0.1%)
David Hawthorne (Alliance) 835 (2.3%, +1.7%)
Kyle Thompson (UKIP) 832 (2.2%)
Hamish Badenoch (Conservative) 132 (0.4%)
Electorate: 70,036; Total Poll: 37,528 (53.6%); Invalid Votes: 526
(1.4%); Valid Votes: 37,002
A good result for Durkan in the SDLP's safest seat.
In a six-seat Assembly election, these votes would give the SDLP
three seats, SF two and the DUP one.
From the 2011 census, Foyle includes:
The entire Derry and Strabane DEA of Ballyarnett
| @William Hay (DUP) 7,154
(18.4%) @Martina Anderson (SF) 6,950 (17.9%) Mark H Durkan (SDLP) 4,970 (12.8%) @Raymond McCartney (SF) 3,638 (9.4%) @Pat Ramsey (SDLP) 3,138 (8.1%) Eamonn McCann (PBPA) 3,120 (8.0%) Colum Eastwood (SDLP) 2,967 (7.6%) @Pol Callaghan (SDLP) 2,624 (6.8%) Paul Fleming (SF) 2,612 (6.7%) Paul McFadden (Independent) 1,280 (3.3%) Keith McGrellis (Alliance) 334 (0.9%) Terry Doherty (Independent) 60 (0.2%) @ member of the Assembly when it was dissolved |
SDLP 13,699 (35.3%, -1.7%) 3 seats SF 13,200 (34.0%, +3.2%) 2 seats DUP 7,154 (18.4%, +1.5%) 1 seat PBPA 3,120 (8.0%) Independents 1,340 (3.5%) Alliance 334 (0.9%, +0.3%) Electorate 68,663 Turnout 39,686 (57.8%); spoilt votes 839 (2.1%) Valid votes 38,847; quota 5,550 |
*@Mark Durkan (SDLP) 16,922 (44.7%,
-1.7%)
@Martina Anderson (Sinn Féin) 12,098 (31.9% -1.4%)
Maurice Devenney (DUP) 4,489 (11.9%, -2.2%)
Eamonn McCann (People Before Profit) 2,936 (7.8%)
David Harding (UCUNF) 1,221 (3.2%, +0.9%)
Keith McGrellis (Alliance) 223 (0.6%)
Electorate: 65,843; Total Poll: 38,190 (58.0%); Invalid Votes: 301
(0.8%); Valid Votes: 37,889
* incumbent
@ elected to the Northern Ireland Assembly from this constituency
A decent result for Durkan, with both SDLP and SF slipping a few votes to Eamonn McCann. An Assembly election on these figures would see no change in seat distribution.
| *William Hay (DUP) 6960
(17.0%) *Mark Durkan MP (SDLP) 6401 (15.6%) Martina Anderson (SF) 5414 (13.2%) Raymond McCartney (SF) 4321 (10.5%) *Pat Ramsey (SDLP) 3242 (7.9%) Lynn Fleming (SF) 2914 (7.1%) *Mary Bradley (SDLP) 2891 (7.0%) Helen Quigley (SDLP) 2648 (6.5%) Eamonn McCann (Socialist Environmental Alliance) 2045 (5.0%) Peggy O'Hara (RSF) 1789 (4.4%) Peter Munce (UUP) 1755 (4.3%) Adele Corry (Green) 359 (0.9%) Yvonne Boyle (Alliance) 224 (0.5%) William Frazer (Independent Unionist) 73 (0.2%) *Elected in 2003 from Foyle |
SDLP 15,182 (37.0%, +0.9%) 3 seats SF 12,649 (30.8%, -1.6%) 2 seats DUP 6,960 (17.0%, +2.0%) 1 seat SEA 2,045 (5.0%, -0.5%) RSF 1,789 (4.4%) UUP 4.3% (-3.9%) Green 359 (0.9%) Alliance 224 (0.5%, -0.01%) Ind U 73 (0.2%) Electorate 64,889 Votes cast 41,455 (63.9%); spoilt votes 419 (1.0%) Valid votes 41,036; quota 5,863 |
@Mark Durkan (SDLP) 21,119 (46.3% -3.9%)
@Mitchel McLaughlin (Sinn Fein) 15,162 (33.2% +6.6%)
@William Hay (DUP) 6,557 (14.4% -0.8%)
Eamonn McCann (Socialist Environmental Alliance) 1,649 (3.6%)
Earl Storey (UUP) 1,091 (2.4% -4.5%)
Ben Reel (Vote for Yourself Rainbow Dream Ticket) 31 (0.1%)
@ Member of the Assembly
Optimists in SF had been talking up their chances (including citing supposedly accurate canvass returns), but the SDLP held on to John Hume's old seat comfortably; SF grumbled that this was due to Unionist tactical voting, though if one compares with the local government elections it's clear that Durkan would have won anyway (and it's rather odd for any self-described democrat to suggest that some people's votes should count for less than others). If cast in a six-seat STV election, these votes would have elected three from the SDLP, two from SF and one from the DUP.
First preference votes cast in the whole of the Derry council area were as follows:
SDLP 18467 (41.0%) Best equivalent result for the SDLP in
Northern Ireland
Sinn Fein 14744 (32.7%)
DUP 7265 (16.1%)
UUP 2000 (4.4%)
SEA 1321 (2.9%)
Independents 1202 (2.7%)
If cast in a six-seat STV election, these votes would have given the SDLP three seats, SF two and the DUP one.
| *Mark Durkan (SDLP) 6806 (16.7%) *William Hay (DUP) 6101 (15.0%) *Mitchell McLaughlin (SF) 6036 (14.8%) Raymond McCartney (SF) 3679 (9.0%) *Mary Nelis (SF) 3499 (8.6%) Mary Bradley (SDLP) 3345 (8.2%) Mary Hamilton (UUP) 3322 (8.1%) Pat Ramsey (SDLP) 2826 (6.9%) Eamonn McCann (SEA) 2257 (5.5%) Gerard Diver (SDLP) 1769 (4.3%) *Annie Courtney (Ind) 802 (2.0%) Alan Castle (Alliance) 227 (0.6%) Danny McBrearty (Ind) 137 (0.3%) |
SDLP 14,746 (36.1%, -11.7%) Best result for SDLP in
Northern Ireland SF 13,214 (32.4%, +6.4%) DUP 6,101 (15.0%, +2.5%) UUP 3,322 (8.1%, -1.5%) SEA 2,257 (5.5%) Best result for SEA in Northern Ireland Ind 939 (2.3%) Alliance 227 (0.6%, -1.6%) Electorate 65,303 |
Electorate: 70,943; votes cast: 49,374 (69.6%); spoilt votes: 495
(1.0%)
Valid votes: 48,879; SDLP majority 11,550
* outgoing MP
@ Member of the Assembly
A solid result for Hume in his party's best constituency. A six-seat Assembly election on these figures would give the SDLP three seats, SF two and the DUP one.
SDLP 20872 (43%) Best equivalent result in Northern Ireland
SF 14547 (30%)
DUP 6874 (14%)
UUP 3069 (6%)
Alliance 436 (1%)
PUP 153 (0.3%)
Independents 2094 (4%)
Total valid votes 48045
It is easy enough to extrapolate from the local council elections because the Derry City Council district and the Foyle constituency cover identical areas. Based on these votes, the SDLP would have won three seats, Sinn Fein two and the DUP one.
| *John Hume (SDLP) 12,581 William Hay (DUP) 6,112 *Mitchel McLaughlin (SF) 5,341 Jack Allen (UUP) 4,669 *Mark Durkan (SDLP) 4,423 *John Tierney (SDLP) 3,778 Mary Nelis (SF) 3,464 Annie Courtney (SDLP) 2,560 Gearoid O hEara (SF) 2,531 Lynn Fleming (SF) 1,360 Colm Cavanagh (All) 1,058 Ken Adams (Lab) 345 Brian Gurney (PUP) 287 Peter MacKenzie (Green) 253 Donn Brennan (NLP) 32 |
SDLP 23,342 (47.84%) 3 seats
Best result for SDLP in Northern Ireland SF 12,696 (26.02%) 2 seats DUP 6,112 (12.53%) 1 seat UUP 4,669 (9.57%) All 1,058 (2.17%) Lab 345 (0.71%) PUP 287 (0.59%) Green 253 (0.52%) NLP 32 (0.07%) Electorate: 68,888 |
* elected in 1996 Forum/talks election from Foyle
One of the least surprising in Northern Ireland, as the SDLP consolidated in one of their best constituencies. Jack Allen of the UUP had the fourth highest number of first preferences here, but was overtaken by the second and third SDLP runners, and by Sinn Féin's Mary Nelis, and finished on 5,698 votes to William Hay's 6,322. A total of 461 undistributed surplus votes, mainly from Sinn Féin, would not have made much difference.
Social Democratic and Labour Party 18,012 votes (44%) Best
equivalent result for SDLP in Northern Ireland
Sinn Féin 11,394 votes (28%)
Democratic Unionist Party 5,186 votes (12%)
Ulster Unionist Party 3,595 votes (9%)
Women's Coalition 1,036 votes (3%)
Labour 348 votes (1%)
UDP 276 votes (1%)
Others 1,359 votes (3%)
Total valid votes 41,206 (60.62% of electorate)
Social Democratic and Labour Party (SDLP) 19,997 (44%); John
Hume, Mark Durkan, John Tierney elected Best result for SDLP
in Northern Ireland
Sinn Féin (SF) 11,618 (26%); Martin McGuinness, Mitchel McLaughlin
elected
Democratic Unionist Party (DUP) 5,054 (11%)
Ulster Unionist Party (UUP) 4,553 (10%)
Alliance Party of Northern Ireland (APNI) 790 (2%)
Northern Ireland Women's Coalition (NIWC) 695 (2%)
Progressive Unionist Party (PUP) 580 (1%)
Labour (Lab) 544 (1%)
Ulster Democratic Party (UDP) 497 (1%)
United Kingdom Unionist Party (UKUP) 324 (1%)
Green Party 191 (0.42%)
Conservative Party (Con) 92 (0.20%)
Workers Party (WP) 81 (0.18%)
Ulster Independence Movement (UIM) 65 (0.14%)
Natural Law Party (NLP) 41 (0.09%)
Democratic Left (DL) 40 (0.09%)
Independent Chambers 22 (0.05%)
Electorate: 66,598; votes cast: 45,308 (68.0%); spoilt votes: 124 (0.2%); valid votes: 45,184
Hume was elected to the old Northern Ireland House of Commons representing Foyle in 1969; he was then elected to the 1973 Assembly, the 1975 Constitutional Convention, and (as was McGuinness) the 1982 Assembly, in all cases for Londonderry.
| DUP | UUP | Oth U | Alliance | Oth | SDLP | SF | |
| 2007a |
17% | 4% | 0% | 1% | 10% | 37% | 31% |
| 2005w | 14% | 2% | 4% | 46% | 33% | ||
| 2005lg | 16% | 4% | 6% | 41% | 33% | ||
| 2003a | 15% | 8% | 1% | 8% | 36% | 32% | |
| 2001w | 15% | 7% | 1% | 50% | 27% | ||
| 2001lg | 14% | 6% | 0% | 1% | 4% | 43% | 30% |
| 1998a | 13% | 10% | 1% | 2% | 1% | 48% | 26% |
| 1997lg | 12% | 9% | 1% | 6% | 44% | 28% | |
| 1997w | 22% | 2% | 0% | 53% | 22% | ||
| 1996f | 11% | 10% | 3% | 2% | 2% | 44% | 26% |
See also: Full 2003 results from Foyle | Full 1998 results from Foyle | The Boundary Commission's Provisional Recommendations | Boundary Commission 2003 | Jim Riley's analysis of votes and seats in the 1998 Assembly election | The constituencies
Other sites based at ARK: ORB (Online Research Bank) | CAIN (Conflict Archive on the INternet) | Northern Ireland Life and Times Survey
Your comments, please! Send an email to me at nicholas.whyte@gmail.com.
 |
This page has been developed with the support of a project grant from the New Initiatives Fund of the Electoral Commission. However, any views expressed on this page or, in particular, other pages of this website are those of the author and not necessarily shared by The Electoral Commission. |
|
Disclaimer:� Nicholas Whyte 1998-2007
|