

| |
|
|
|
|
|
|
 |
| Map and graph by Conal Kelly | |
This constituency contains a large part of Lisburn and Castlereagh District Council and the Dromore, Aghagallon and Donaghcloney areas of Armagh, Banbridge and Craigavon District Council. The MP is Sorcha Eastwood (Alliance); in the 2024 election she replaced Jeffrey Donaldson (elected as UUP in 1997 and 2001, and as DUP in 2005); he had replaced his former party's former leader James Molyneaux in 1997. In the 2022 Assembly election the DUP and Alliance won two seats each, and the UUP one. See also the 1983-92 Lagan Valley results.
Under the new boundaries, Lagan Valley lost Drumbo to South
Belfast and Mid Down, and more significantly Dunmurry to West
Belfast, while gaining the eastern fringes of Lurgan from Upper
Bann.
At Assembly level, Nationalists were able to win a seat in Lagan
Valley in a good year, and these changes make good years more
likely, though Alliance would still have a good chance of holding
their second seat.
2024 Westminster Result:
Sorcha-Lucy Eastwood (Alliance) 18,618 (37.9%, +10.9%)
Jonathan Buckley (DUP) 15,659 (31.9% -11.5%)
Robbie Butler (UUP) 11,157 (22.7%, +4.2%)
Lorna Smyth (TUV) 2,186 (4.5%)
Simon Lee (SDLP) 1,028 (2.1%, -2%)
Patricia Denvir (Green) 433 (0.9%)
Total vote 49,243 (59.9%); total valid vote 49,081; invalid 162 (0.3%)
An exceptional result for the Alliance Party, in the wake of
Jeffrey Donaldson and his wife facing criminal charges of
historical sex abuse.
In a five-seat Assembly election, this would give the Alliance
and DUP two seats each, and the UUP one, which was also the result
of the 2022 Assembly election.
2019 Westminster notional result on new boundaries:
DUP 19,840 (43.4%)
Alliance 12.365 (27.1%)
UUP 8,460 (18.5%)
SF 1,944 (4.4%)
SDLP 1,855 (4.1%)
Conservative 878 (1.9%)
UKIP 315 (0.7%)
| DUP | UUP | UKIP | Cons | APNI | SDLP | SF | ||
| 2019 actual |
19,586 | 8,606 | 315 | 955 | 13,087 | 1,758 | 1,098 | |
| 43.1% | 19.0% | 0.7% | 2.1% | 28.8% | 3.9% | 2.4% | ||
| From Lagan Valley |
To Lagan Valley | 18,020 | 7,910 | 315 | 878 | 11,793 | 1,441 | 900 |
| From Lagan Valley | To West Belfast |
-840 | -370 | -41 | -898 | -272 | -170 | |
| From Lagan Valley | To South Belfast and Mid Down |
-611 | -276 | -31 | -320 | -34 | -22 | |
| From Lagan Valley | To South Antrim | -88 | -39 | -4 | -59 | -8 | -5 | |
| From Lagan Valley | To South Down |
-27 | -12 | -1 | -18 | -2 | -2 | |
| From Upper Bann |
To Lagan Valley | 1,818 | 550 | 571 | 410 | 1,090 | ||
| From South Down | To Lagan Valley | 2 | 1 | 2 | 4 | 4 | ||
| 2019 notional |
19,840 | 8,460 | 315 | 878 | 12,365 | 1,855 | 1,994 | |
| 43.4% | 18.5% | 0.7% | 1.9% | 27.1% | 4.1% | 4.4% | ||
| +0.3% | -0.4% | +0.0% | -0.2% | -1.8% | +0.2% | +1.9% |
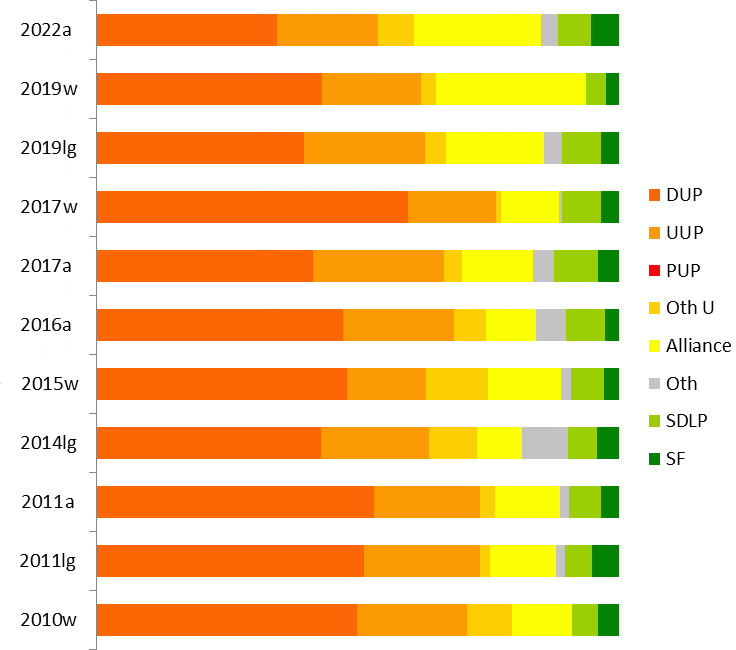
| DUP | UUP | Oth U | Alliance | Oth | SDLP | SF | |
| 2024w |
31.9% |
22.7% | 4.5% |
37.9% |
0.9% |
2.1% |
|
| 2022a |
34.7% | 19.3% | 6.8% | 24.3% | 3.2% | 6.3% | 5.3% |
| 2019w | 43.1% | 19.0% | 2.8% | 28.8% | 3.9% | 2.4% | |
| 2019lg |
39.6% | 23.2% | 4.9% | 18.7% | 2.8% | 7.4% | 3.4% |
| 2017w | 59.6% | 16.8% | 1.0% | 11.1% | 0.5% | 7.5% | 3.5% |
| 2017a |
41.3% | 25.2% | 3.5% | 13.5% | 4.1% | 8.4% | 4.0% |
| 2016a |
47.2% | 21.2% | 6.2% | 9.5% | 5.7% | 7.5% | 2.7% |
| 2015w |
47.9% | 15.2% | 11.8% | 13.9% | 1.9% | 6.3% | 2.9% |
| 2014lg |
43.0% | 20.6% | 9.3% | 8.6% | 8.7% | 5.5% | 4.2% |
| 2011a |
53.1% | 20.4% | 2.9% | 12.4% | 1.7% | 6.1% | 3.4% |
| 2011lg |
51.4% | 22.2% | 2.0% | 12.5% | 1.8% | 5.2% | 5.1% |
| 2010w | 49.8% | 21.1% | 8.6% | 11.4% | 5.0% | 4.0% | |
| 2007a |
52.3% | 20.3% | 2.2% | 10.3% | 3.8% | 4.0% | 7.2% |
| 2005w | 58.3% | 23.0% | 10.9% | 3.5% | 4.3% | ||
| 2005lg | 53.3% | 28.4% | 10.3% | 1.4% | 3.4% | 3.0% |
NB that the figures for elections before 2010 are projections.
Figures for the previous boundaries can be found at the bottom of
this page.
NB also that the Conservatives got 0.9% in 2007 (on the previous
boundaries) and supported the UUP in 2010 and 2011.
| Jeffrey Donaldson
(DUP) 12,626 (24.7%) @Robbie Butler (UUP) 8,242 (16.2%) Sorcha Eastwood (Alliance) 8,211 (16.1%) @Paul Givan (DUP) 5,062 (9.9%) David Honeyford (Alliance) 4,183 (8.2%) Lorna Smyth (TUV) 3,488 (6.8%) @Pat Catney (SDLP) 3,235 (6.3%) Gary McCleave (SF) 2,725 (5.3%) Laura Turner (UUP) 1,607 (3.1%) Gary Hynds (Ind) 735 (1.4%) Simon Lee (Green) 648 (1.3%) Amanda Doherty (PBP) 271 (0.5%) @ member of the Assembly when it was dissolved. |
DUP 17,688 (34.7%, -6.6%)
2 seats Alliance 12,394 (24.3%, +10.8%) 2 seats UUP 9,849 (19.3%, -5.9%) 1 seat TUV 3,488 (6.8%, +3.7%) SDLP 3,235 (6.3%, -2.1%) (-1) SF 2,725 (5.3%, +1.3%) Ind 735 (1.4%) Green 648 (1.3%, -0.7%) PBP 271 (0.5%) Electorate: 81,562 Votes cast: 51,543 (63.2%, +0.6%), spoilt votes 510 (1.%) Valid votes: 51,033, quota 8,506 |
*Jeffrey Donaldson (DUP) 19,586 (43.1%, -16.4%)
Sorcha Eastwood (Alliance) 13,087 (28.8%, +17.7%)
@Robbie Butler (UUP) 8,606 (19.0%, +2.2%)
Ally Haydock (SDLP) 1,758 (3.9%, -3.7%)
Gary McCleave (SF) 1,098 (2.4%, -1.1%)
Gary Hynds (Cons) 955 (2.1%, +1.1%)
Alan Love (UKIP) 315 (0.7%, +0.7%)
* outgoing MP.
@ member of the Assembly.
Electorate: 75,735; Total Poll: 45,589 (60.2%); Invalid Votes:
184 (0.4%); Valid Votes: 45,405
A large increase in Alliance vote that appears to have come
mostly from DUP (down 16%) but also from the Nationalist parties.
In a five-seat Assembly election, these votes would give the DUP
and Alliance two seats each and the UUP one.
From the 2011 census, Lagan Valley includes:
The entire Lisburn and Castlereagh DEA of Downshire East| @Paul Givan (DUP)
8,035 (17.8%) @Robbie Butler (UUP) 6,846 (15.2%) @Trevor Lunn (Alliance) 6,105 (13.5%) @Edwin Poots (DUP) 6,013 (13.3%) @Brenda Hale (DUP) 4,566 (10.1%) @Jenny Palmer (UUP) 4,492 (10.0%) Pat Catney (SDLP) 3,795 (8.4%) Peter Doran (SF) 1,801 (4.0%) Samuel Morrison (TUV) 1,389 (3.1%) Dan Barrios-O'Neill (Green) 912 (2.0%) Jonny Orr (Ind) 856 (1.9%) Matthew Robinson (Con) 183 (0.4%) Keith Gray (Ind) 76 (0.2%) @ member of the Assembly when it was dissolved. |
DUP 18,614 (41.3%, -5.9%)
2 seats (-1) UUP 11,338 (25.2%, +4.0%) 1 seat (-1) Alliance 6,105 (13.5%, +4.0%) 1 seat SDLP 3,795 (8.4%, +0.9%) 1 seat (+1) SF 1,801 (4.0%, +1.3%) TUV 1,389 (3.1%, -0.2%) Ind 932 (2.1%) Green 912 (2.0%, -0.9%) Con 183 (0.4%, -0.5%) Electorate: 72,621 Votes cast: 45,440 (62.6%, +9.4%), spoilt votes 371 (0.8%) Valid votes: 45,069, quota 7,512 |
| @Paul Givan (DUP) 5,364
(13.8%) @Edwin Poots (DUP) 4,638 (11.9%) Robbie Butler (UUP) 4,376 (11.3%) @Brenda Hale (DUP) 4,236 (10.9%) Jonathan Craig (DUP) 4,087 (10.5%) Jennifer Palmer (UUP) 3,871 (10.0%) @Trevor Lunn (Alliance) 3,707 (9.5%) Pat Catney (SDLP) 2,899 (7.5%) Lyle Rea (TUV) 1,291 (3.3%) Dan Barrios-O'Neill (Green) 1,118 (2.9%) Jacqui McGeough (Sinn Féin) 1,045 (2.7%) Jonny Orr (Independent) 817 (2.1%) Brian Higginson (UKIP) 768 (2.0%) Jack Irwin (Conservative) 341 (0.9%) Peter Dynes (NI Labour) 171 (0.4%) Frazer McCammond (Democracy First) 124 (0.3%) @ member of the Assembly when it was dissolved. |
DUP 18,325 (47.2%, -5.9%)
3 seats (-1) UUP 8,247 (21.2%, +0.8%) 2 seats (+1) Alliance 3,707 (9.5%, -2.9%) 1 seat SDLP 2,899 (7.5%, +1.4%) TUV 1,291 (3.3%, +0.4%) Green 1,118 (2.9%, +1.2%) Sinn Féin 1,045 (2.7%, -0.7%) Independent 817 (2.1%) UKIP 768 (2.0%) Conservative 341 (0.9%) NI Labour 171 (0.4%) Democracy First 124 (0.3%) Electorate 73,746 Votes cast 39,227 (53.2%); spoilt votes 374 (1.0%) Valid votes 38,853; quota 5551 |
*Jeffrey Donaldson (DUP) 19,055 (47.9%, -1.9%)
Alexander Redpath (UUP) 6,055 (15.2%, -5.9%)
Trevor Lunn (Alliance) 5,544 (13.9%, +2.5%)
Pat Catney (SDLP) 2,500 (6.3%, +1.3%)
Alan Love (UKIP) 2,200 (5.5%)
Samuel Morrison (TUV) 1,887 (4.7%, -3.9%)
Jacqui McGeough (SF) 1,144 (2.9%, -1.1%)
Jonny Orr (Ind) 756 (1.9%)
Helen Osborne (Conservative) 654 (1.6%)
Electorate: 71,152; Total Poll: 39,986 (56.2%); Invalid Votes: 191
(0.5%); Valid Votes: 39,795
A solid defence by Donaldosn, improved by the slump in the UUP
vote, the main bebeficiries of which seem to have been UKIP.
If cast in a six-seat Assembly election, these votes would give
the DUP three seats and the UUP and Alliance one each. The last is
tough to call; I think it would be more likely to go to a fourth
DUP candidate than either UKIP or the SDLP.
From the 2011 census, Lagan Valley includes:
The entire Lisburn and Castlereagh DEA of Downshire East| @Edwin Poots (DUP) 7,329 (20.7%) @Basil McCrea (UUP) 5,771 (16.3%) @Trevor Lunn (Alliance) 4,389 (12.4%) @Paul Givan (DUP) 4,352 (12.3%) @Jonathan Craig (DUP) 4,263 (12.0%) Brenda Hale (DUP) 2,910 (8.2%) Pat Catney (SDLP) 2,165 (6.1%) Mark Hill (UUP) 1,482 (4.2%) Mary-Kate Quinn (SF) 1,203 (3.4%) Lyle Rea (TUV) 1,031 (2.9%) Conor Quinn (Green) 592 (1.7%) @ member of the Assembly when it was dissolved. |
DUP 18,854 (53.1%, +0.8%)
4 seats (+1) UUP 7,253 (20.4%, +0.1%) 1 seat Alliance 4,389 (12.4%, +2.1%) 1 seat SDLP 2,165 (6.1%, +2.1%) SF 1,203 (3.4%, -3.8%) (-1) TUV 1,031 (2.9%) Green 592 (1.7%, -0.5%) Electorate 67,532 Votes cast 35,842 (53.1%); spoilt votes 355 (1.0%) Valid votes 35,487; quota 5070 |
Sinn Féin lost a seat to the DUP,
thanks to boundary changes; an impressive performance by the DUP,
helped by woeful balancing from the UUP who could have won a
second seat here if they were capable of discipline. Brenda Hale
of the DUP was almost 1400 votes ahead of the SDLP's Pat Carey for
the last seat, with another 450 undistributed DUP surplus votes
which would have widened the gap still further (though another 50
undistributed surplus votes, which had started with SF and
transferred to Alliance, might have put a small dent in that).
*@Jeffrey Donaldson (DUP)
18,199 (49.8%, -8.5%)
Daphne Trimble (UCUNF) 7,713 (21.1%, -1.9%)
Trevor Lunn (Alliance) 4,174 (11.4%, +0.5%)
Keith Harbinson (TUV) 3,154 (8.6%)
Brian Heading (SDLP) 1,835 (5.0%, +1.5%)
Paul Butler (Sinn Féin) 1,465 (4.0%, -0.3%)
Electorate: 65,257; Total Poll: 36,678 (56.2%); Invalid Votes: 138
(0.4%); Valid Votes: 36,540
* incumbent
@ elected to the Northern Ireland Assembly from this constituency
Despite some slippage of the DUP vote to the TUV, Donaldson comfortably held his seat. Farther down the table, the SDLP outpolled SF for the first time since 2001, but not enough to preserve a Nationalist seat at Assembly level. These votes would give the DUP three seats, and the UUP and Alliance one each, with the last between the DUP's fourth and the UUP's second candidates.
| *Jeffrey Donaldson MP
(DUP) 9793 (23.4%) Paul Butler (SF) 5098 (12.2%) Basil McCrea (UUP) 4031 (9.6%) Trevor Lunn (Alliance) 3765 (9.0%) Jonathan Craig (DUP) 3471 (8.3%) *Edwin Poots (DUP) 3457 (8.3%) Paul Givan (DUP) 3377 (8.1%) +Marietta Farrell (SDLP) 2839 (6.8%) *Billy Bell (UUP) 2599 (6.2%) Ronnie Crawford (UUP) 1147 (2.7%) Michael Rogan (Green) 922 (2.2%) ^Robert McCartney (UKUP) 853 (2.0%) Neil Johnston (Conservative) 387 (0.9%) John Magee (WP) 83 (0.2%) *Elected in 2003 from Lagan Valley ^Elected in 2003 from North Down +Appointed to 2003-07 Assembly to fill a vacancy |
DUP 20,098 (48.1%, +27.5%) 3 seats (+2) UUP 7,777 (18.6%, -27.6%) 1 seat (-2) SF 5,098 (12.2%, +4.3%) 1 seat (+1) Alliance 3,765 (9.0%, -1.7%) 1 seat) SDLP 2,839 (6.8%, -0.8%) (-1) Green 922 (2.2%) UKUP 853 (2.0%) Conservative 387 (0.9%, -0.03%) WP 83 (0.2%, -0.04%) Electorate 70,101 Votes cast 42,058 (60.0%); spoilt votes 236 (0.6%) Valid votes 41,822; quota 5,975 |
*@Jeffrey Donaldson (DUP) 23,289 (54.7% +41.3%)
Basil McCrea (UUP) 9,172 (21.5% -35.0%)
@Seamus Close (Alliance) 4,316 (10.1% -6.5%)
Paul Butler (Sinn Fein) 3,197 (7.5% +1.6%)
@Patricia Lewsley (SDLP) 2,598 (6.1% -1.4%)
* outgoing MP
@ Member of the Assembly
An impressive result for Donaldson running under his new party banner. These results, if cast in a six-seat STV election, would have brought the DUP three seats and the UUP one; Alliance would be pretty likely to get one of the other two, with the last between Sinn Fein and a fourth DUP candidate.
DUP 18842 (45.4%)
UUP 10737.3 (25.9%) Best equivalent result for UUP in Northern
Ireland
Sinn Fein 4199.771429 (10.1%)
Alliance 3907 (9.4%)
SDLP 3204.742857 (7.7%)
Conservative 333 (0.8%)
Green 284 (0.7%)
If these votes were cast in a six-seat STV election, the DUP would win three seats, the UUP probably two, with the last between Alliance and Sinn Fein. These figures probably overestimate the Nationalist parties' vote share, because I have treated Dunmurry Cross and Dromore as if they were homogenous, when in both cases the parts of the DEA in Lagan Valley are markedly more Unionist than the parts outside the constituency.
| Jeffrey
Donaldson (UUP) 14104 (34.2%) *Edwin Poots (DUP) 5175 (12.5%) *Seamus Close (Alliance) 4408 (10.7%) Andrew Hunter (DUP) 3300 (8.0%) Paul Butler (SF) 3242 (7.9%) *Patricia Lewsley (SDLP) 3133 (7.6%) *Billy Bell (UUP) 2782 (6.7%) *Ivan Davis (Ind) 2223 (5.4%) Norah Beare (UUP) 1508 (3.7%) Jim Kirkpatrick (UUP) 675 (1.6%) Joanne Johnston (Cons) 395 (1.0%) Frances McCarthy (WP) 97 (0.2%) Andrew Park (PUP) 212 (0.5%) |
UUP 19,069 (46.2%, +15.4%) 3
seats Best result for UUP in Northern Ireland
DUP 8,475 (20.5%, +2.5%) 1 seat Alliance 4,408 (10.7%, -3.9%) 1 seat SF 3,242 (7.9%, +3.6%) SDLP 3,133 (7.6%, -1.1%) 1 seat Ind 2,223 (5.4%) Con 395 (1.0%, -0.5%) PUP 212 (0.5%) WP 97 (0.2%, -0.2%) Electorate 67,910 |
Reaction: UUP gain from UKUP in their best result of the election. SDLP managed to defend against both SF and DUP challenges, though it was a narrow thing, with only 258 votes separating Butler and Lewsley on the crucial count and the resulting surplus roughly doubling Beare's final margin over Hunter to 612.
Lagan Valley had lost 10.22% of its electorate in the great electoral register shake-out, varying from 15.92% in the Old Warren ward of Lisburn to 6.21% in the Quilly ward of Banbridge. 8 constituencies lost fewer voters, 9 lost more.
Subsequent development: Donaldson and Beare resigned from the UUP on 18 December 2003 and subsequently joined the DUP.
Electorate: 72,671; votes cast: 46,222 (63.6%); spoilt votes: 281
(0.6%)
Valid votes: 45,941; UUP majority 18,342
*outgoing MP
@ member of the Assembly
The least surprising result in Northern Ireland, in an election that elsewhere was full of drama. A six-seat Assembly election on these votes would give the UUP four seats, Alliance one, and a close race between the SDLP and DUP for the last seat.
UUP 17543.3 (39%) Best equivalent result in Northern Ireland
DUP 10849.6 (24%)
Alliance 5169 (11%)
SF 3940 (9%)
SDLP 3423.5 (8%)
Conservative Party 636 (1%)
NIUP 100 (0.2%)
Inds 3377.4 (7%)
Total valid 45038.8
If these votes had been cast in a six-seat STV election, the UUP would have won two seats, and the DUP, Alliance and SF one each. The last seat would have been between the second DUP candidate and a third UUP candidate.
| #Seamus Close (Alliance) 6,788 Billy Bell (UUP) 5,965 Patrick Roche (UKU) 5,361 *Edwin Poots (DUP) 5,239 Patricia Lewsley (SDLP) 4,039 *Ivan Davis (UUP) 3,927 #Gary McMichael (UDP) 3,725 *David Campbell (UUP) 3,158 *Cecil Calvert (DUP) 3,111 Paul Butler (SF) 2,000 Ken Hull (UUP) 1,289 Annie Campbell (NIWC) 955 William Bleakes (C) 702 Frances McCarthy (WP) 208 John Collins (NLP) 43 |
UUP 14,339 (30.83%) 2 seats
DUP 8,350 (17.95%) 1 seat Alliance 6,788 (14.59%) 1 seat UKU 5,361 (11.53%) 1 seat SDLP 4,039 (8.68%) 1 seat UDP 3,725 (8.01%) SF 2,000 (4.30%) NI Women 955 (2.05%) C 702 (1.51%) WP 208 (0.45%) NLP 43 (0.09%) Electorate: 71,661 |
* elected in 1996 Forum/talks election from Lagan Valley
# elected in 1996 Forum/talks election as a 'top-up' candidate.
A very disappointing result for the UUP, not helped by the public row within the party over the leadership's bar on dissident MP Jeffrey Donaldson from running. The chief beneficiary of this was Paddy Roche of the UKUP, another of that party's unexpected gains. Gary McMichael of the UDP failed to make the breakthrough and finished as runner-up. Another unexpected winner was Patricia Lewsley of the SDLP, who finished with 6,282 votes to McMichael's 4,970. There were over a thousand votes in undistributed surpluses, most of which would have favoured McMichael.
Ulster Unionist Party (UUP) 16,367 (37%) Jeffrey Donaldson,
Robert Campbell, Ivan Davis elected Best result for UUP in
Northern Ireland
Democratic Unionist Party (DUP) 9,592 (22%); Cecil Calvert, Edwin
Poots elected
Alliance Party of Northern Ireland (APNI) 4,508 (10%)
Social Democratic and Labour Party (SDLP) 4,001 (9%)
Ulster Democratic Party (UDP) (7%)
United Kingdom Unionist Party (UKUP) (5%)
Sinn Féin (SF) 1,132 (3%)
Progressive Unionist Party (PUP) 1,072 (2%)
Northern Ireland Women's Coalition (NIWC) 520 (1%)
Conservative Party (Con) 386 (1%)
Green Party 175 (0.39%)
Ulster Independence Movement (UIM) 164 (0.37%)
Labour (Lab) 143 (0.32%)
Workers Party (WP) 72 (0.16%)
Democratic Left (DL) 43 (0.10%)
Natural Law Party (NLP) 18 (0.04%)
Independent Chambers 3 (0.01%)
Electorate: 70,045; votes cast: 43,482 (62.0%); spoilt votes: 27 (0.0%); valid votes: 43,455
Davis had been elected to the 1982 Assembly for South Antrim; Donaldson was also elected to it in a 1985 by-election for South Down.
| DUP | UKUP | UUP | UDP | Oth U | Alliance | Oth | SDLP | SF | |
| 2007a |
48% | 2% | 19% | 2% | 9% | 3% | 7% | 12% | |
| 2005w | 55% | 22% | 10% | 6% | 8% | ||||
| 2005lg | 45% | 26% | 1% | 9% | 1% | 8% | 10% | ||
| 2003a | 21% | 46% | 7% | 11% | 0% | 8% | 8% | ||
| 2001w | 13% | 57% | 17% | 8% | 6% | ||||
| 2001lg | 24% | 39% | 2% | 11% | 7% | 8% | 9% | ||
| 1998a | 18% | 12% | 31% | 8% | 2% | 15% | 3% | 9% | 4% |
| 1997lg | 14% | 41% | 5% | 7% | 15% | 4% | 7% | 7% | |
| 1997w | 14% | 55% | 3% | 17% | 1% | 8% | 3% | ||
| 1996f | 22% | 5% | 37% | 7% | 3% | 10% | 3% | 9% | 3% |
See also: Full 2003 results from Lagan Valley | Full 1998 results from Lagan Valley | The Boundary Commission's Provisional Recommendations | Boundary Commission 2003 | Jim Riley's analysis of votes and seats in the 1998 Assembly election | The constituencies
Other sites based at ARK: ORB (Online Research Bank) | CAIN (Conflict Archive on the INternet) | Northern Ireland Life and Times Survey
Your comments, please! Send an email to me at nicholas.whyte@gmail.com.
 |
This page has been developed with the support of a project grant from the New Initiatives Fund of the Electoral Commission. However, any views expressed on this page or, in particular, other pages of this website are those of the author and not necessarily shared by The Electoral Commission. |
Nicholas Whyte, 3 June 1998; last updated 7 May 2022 by Conal Kelly.
|
Disclaimer:� Nicholas Whyte 1998-2015
|