

|
|
|
|
|
|
|
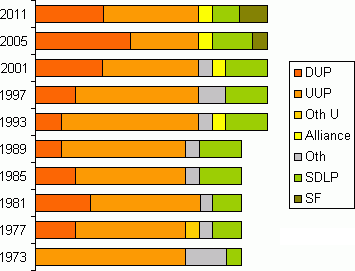
The 2011
contest saw the UUP pick up two seats from the DUP thereby
becoming the largest party on the council. Overall, Banbridge
was the UUP's best result of the election with 33.8% of the
first preference vote. Sinn Fein also gained a seat in Dromore
from their rivals in the SDLP.
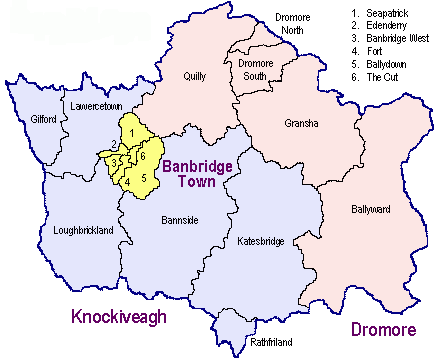
Map by
Conal Kelly
| Electoral Area | 2011 Result | 2005 Result | 2001 Result | 1997 Result | 1993 Result |
| Dromore | 2 DUP, 2 UUP, 1 SF | 3 DUP, 1 UUP, 1 SDLP | 2 UUP, 2 DUP, 1 SDLP | 3 UUP, 1 DUP, 1 SDLP | 3 UUP, 1 DUP, 1 SDLP |
| Town | 2 UUP, 2 DUP, 1 SDLP, 1 Alliance | 2 UUP, 2 DUP, 1 SDLP, 1 Alliance | 3 UUP, 1 DUP, 1 SDLP, 1 Alliance | 3 UUP, 1 Ind, 1 DUP, 1 SDLP | 4 UUP, 1 SDLP, 1 Alliance |
| Knockiveagh | 3 UUP, 1 DUP, 1 SDLP, 1 SF | 2 UUP, 2 DUP, 1 SDLP, 1 SF | 2 UUP, 2 DUP, 1 SDLP, 1 Ind | 3 UUP, 1 SDLP, 1 DUP, 1 Ind | 3 UUP, 1 SDLP, 1 DUP, 1 Ind |
Summary
| 2011 Results | 2005 Results | 2001 Results | 1997 Results | 1993 Results |
| Votes
by Party: UUP: 6,167 (33.8%), 7 councillors DUP: 5,904 (32.4%), 5 councillors SDLP: 2,409 (13.2%), 2 councillors SF: 2,071 (11.4%), 2 councillors Alliance: 892 (4.9%), 1 councillor TUV: 458 (2.5%) Ind: 335 (1.8%) |
Votes
by Party: DUP: 7,251 (38.3%), 7 councillors UUP: 6,122 (32.4%), 5 councillors SDLP: 2,999 (15.9%), 3 councillors SF: 1,187 (6.3%), 1 councillor Alliance: 856 (4.5%), 1 councillor Ind: 498 (2.6%) |
Votes
by Party: UUP: 7,702 (37.4%), 7 councillors DUP: 5,697 (27.7%), 5 councillors SF: 755 (3.7%) SDLP: 3,957 (19.2%), 3 councillors Alliance: 420 (2.0%), 1 councillor UKUP: 776 (3.8%) NIUP: 45 (0.3%) Ind: 1,216 (5.9%), 1 councillor |
Votes
by Party: UUP: 8,408 (52.4%), 9 councillors DUP: 2,454 (15.3%), 3 councillors SDLP: 2,870 (17.9%), 3 councillors Alliance: 822 (5.1%) Ind: 1,501 (9.3%), 2 councillors |
Votes
by Party: UUP: 9,418 (57.6%), 10 councillors DUP:2,203 (13.5%), 2 councillors SDLP: 3,705 (22.7%), 3 councillors Alliance: 289 (1.8%), 1 councillor Ind: 732 (4.4%), 1 councillor |
| Electorate:
32,834; votes cast: 18,524; spoilt votes: 288 (1.6%); valid votes: 18,236 (98.4%) |
Electorate:
30,303; votes cast: 19,226; spoilt votes: 313 (1.6%); valid votes: 18,913 (98.4%) |
Electorate:
30,025; votes cast: 20,897; spoilt votes: 329 (1.6%); valid votes: 20,568 (98.4%) |
Electorate:
28,268; votes cast: 16,275; spoilt votes: 220 (1.3%); valid votes: 16,055 (98.7%) |
Electorate: ; votes cast: ; spoilt votes: (%); valid votes: (%) |
2001 Census: 13,024 "Catholic" (31.47%); 27,337 "Protestant" (66.04%); 97 Other (0.23%); 934 None (2.26%) |
||||
See also
results from 1985-89 and 1973-81.
For a draft version of the full counts in Banbridge elections
from 1993 to 2001, please click here.
| First
Count: Paul Rankin, (DUP) 967 Hazel Gamble, (DUP) 943 Carol Black, (UUP) 820 Olive Mercer, (UUP) 707 Norah Beare, (DUP) 685 Paul Gribben, (SF) 597 Louis Boyle, (SDLP) 488 David Griffin, (Alliance) 409 Lyle Rea, (TUV) 249 |
Votes
by Party: DUP: 2,595 (44.2%), 2 seats UUP: 1,527 (26.0%), 2 seats SF: 597 (10.2%), 1 seat SDLP: 488 (8.3%) Alliance: 409 (7.0%) TUV: 249 (4.2%) |
| Electorate:
10,290; seats: 5; votes cast: 5,924 spoilt votes: 59
(1.0%); valid votes: 5,865 (99.0%); quota: 978 |
| First Count | Exclude Drake + Corry | Exclude Griffin | Exclude Gribben | Exclude Harbinson | ||||||
| Carol Black | UUP | 912 | 25 | 937 | 182 | 1119 | 75 | 1194 | 377 | 1571 |
| Paul Stewart | DUP | 1069 | 5 | 1074 | 53 | 1127 | 51 | 1178 | 330 | 1508 |
| Keith Harbinson | TUV | 739 | 3 | 742 | 59 | 801 | 27 | 828 | -828 | |
| Paul Gribben | SF | 350 | 157 | 507 | 60 | 567 | -567 | |||
| David Griffin | Alliance | 357 | 122 | 479 | -479 | |||||
| John Drake | SDLP | 290 | -290 | |||||||
| Helen Corry | Green | 59 | -59 | |||||||
Electorate 9,688; votes cast 3,793 (39.2%); spoilt votes 17 (0.4%); valid votes 3,776.
UUP 24.2% (-7.1%); DUP 28.3% (-21.5%); TUV 19.6%; SF 9.3% (+2.1%); Alliance 9.5%; SDLP 7.7% (-4.1%); Green 1.6%
2005
Results
DUP gain
from UUP. (spreadsheet)
| First
Count: Tyrone Howe, (UUP) 1304 Norah Beare, (DUP) 1292 Paul Rankin, (DUP) 870 David Herron, (DUP) 838 Cassie McDermott, (SDLP) 712 William Martin, (UUP) 580 Francis Branniff, (SF) 429 |
Votes by Party: DUP: 3,000 (49.8%), 3 seats UUP: 1,184 (31.3%), 1 seat SDLP: 712 (11.8%), 1 seat SF: 429 (7.1%) |
| Electorate:
9,542; seats: 5; votes cast: 6,119; spoilt votes: 94
(1.5%); valid votes: 6,025; quota: 1,005 |
| First
Count: Paul Rankin, (DUP) 1,375 Cassie McDermott, (SDLP) 1,202 David Herron, (DUP) 1,032 Norah Beare, (UUP) 896 William Martin, (UUP) 894 Thompson Howe, (UUP) 685 Joseph Boyd McIlwaine, (NIUP) 45 |
Votes by Party: UUP: 2,475 (40.4%), 2 seats DUP: 2,407 (39.3%), 2 seats SDLP: 1,202 (19.6%), 1 seat NIUP: 45 (0.7%) |
| Electorate:
9,149; seats: 5; votes cast: 6,232; spoilt votes: 103
(1.6%); valid votes: 6,129 (98.4%); quota: 1,022 |
|
| 2001 Census: 2,737 "Catholic" (21.86%); 9,420 "Protestant" (75.24%); 25 Other (0.20%); 338 None (2.70%) | |
| First Preferences | McDermott votes | ||
| Paul Rankin (DUP) | 1603 | +27 | 1630 |
| Gavin Hughes (UUP) | 1251 | +173 | 1424 |
| Liam McDermott (SDLP) | 521 | -521 | - |
| First
Count: William McCracken, (UUP) 1,358 Tom Gribben, (UUP) 667 William Martin, (UUP) 709 David Herron, (DUP) 770 Cassie McDermott, (SDLP) 729 Robert Hill, (Ind U) 289 Julian Crozier, (Alliance) 202 |
Votes
by Party: UUP: 2,734 (57.8%), 3 seats DUP: 770 (16.4%), 1 seat SDLP: 729 (15.4%), 1 seat Alliance: 202 (4.3%) Ind U: 289 (6.1%) |
| Electorate:
8,457; seats: 5; votes cast: 4,787; spoilt votes: 48
(1.0%); valid votes: 4,739 (99.0%); quota: 787 |
| First
Count: Drew Nelson, (UUP) 980 Catherine McDermott, (SDLP) 951 David Herron, (DUP) 873 William John Martin, (UUP) 771 William McCracken, (UUP) 745 Robert Samuel Hill, (UUP) 673 |
Votes
by Party: UUP: 3,169 (63.5%), 3 seats DUP: 873 (17.5%), 1 seat SDLP: 951 (19.0%), 1 seat |
| Electorate:
7,917; seats: 5; votes cast: 5,063; spoilt votes: 70
(0.9%); valid votes: 4,993 (99.1%); quota: 833 |
2011: **DUP
44%, **UUP 26%, *SF 10%, SDLP 8%, Alliance 7%, TUV 4%
2008: *UUP 24%, DUP 28%, TUV 20%, SF 9%, Alliance 9%, SDLP 8%,
Green 2%
2005: ***DUP 50%, *UUP 31%, *SDLP 12%, SF 7%
2001: **UUP 40%, **DUP 39%, *SDLP 20%, NIUP 1%
(2000 By-Election: *DUP 48%, UUP 37%, SDLP 15%)
1997: ***UUP 58%, *DUP 16%, *SDLP 15%, Ind U 6%, Alliance 4%
1993: ***UUP 64%, *SDLP 19%, *DUP 18%
| First
Count: Joan Baird, (UUP) 1466 Junior McCrum, (DUP) 1038 Ian Burns, (UUP) 676 Sheila McQuaid, (Alliance) 483 Jim McElroy, (DUP) 473 Vincent McAleenan, (SF) 435 Marie Hamilton, (SDLP) 367 Dessie Ward, (Ind) 335 Cassie McDermott, (SDLP) 316 John McKinstry, (DUP) 308 |
Votes
by Party: UUP: 2,142 (36.3%), 2 seats DUP: 1,819 (30.8%), 2 seats SDLP: 683 (11.6%), 1 seat Alliance: 483 (8.2%), 1 seat SF: 435 (7.4%), Ind: 335 (5.7%) |
| Electorate:
11,532; seats: 6; votes cast: 6,021; spoilt votes: 124
(2.1%); valid votes: 5,897 (97.9%); quota: 843 |
| First
Count: Joan Baird, (UUP) 1501 Patrick McAleenan, (SDLP) 1236 Jim McElroy, (DUP) 1089 Junior McCrum, (DUP) 947 Frank McQuaid, (Alliance) 556 Ian Burns, (UUP) 549 Derick Bell, (UUP) 331 |
Votes
by Party: UUP: 2,381 (38.3%), 2 seats DUP: 2,036 (32.8%), 2 seats SDLP: 1,236 (19.9%), 1 seat Alliance: 556 (9.0%), 1 seat |
| Electorate:
10,610; seats: 6; votes cast: 6,311; spoilt votes: 102
(1.6%); valid votes: 6,209 (98.4%); quota: 888 |
| First
Count: Kathleen Joan Baird, (UUP) 1,979 Patrick McAleenan, (SDLP) 1,404 Jim McElroy, (DUP) 774 Kyle Ferguson, (DUP) 697 Ian Burns, (UUP) 485 Derick William Bell, (UUP) 458 Frank Downey, (Ind) 448 Frank McQuaid, (Alliance) 420 David Hudson, (UKUP) 389 |
Votes
by Party: UUP: 2,922 (41.4%), 3 seats DUP: 1,471 (20.8%), 1 seat SDLP: 1,404 (19.9%), 1 seat Alliance: 420 (6.0%), 1 seat UKUP: 389 (5.5%) Ind: 448 (6.4%) |
| Electorate:
10,939; seats: 6; votes cast: 7,172; spoilt votes: 118
(1.6%); valid votes: 7,054 (98.4%); quota: 1,008 |
|
| 2001 Census: 5,115 "Catholic" (33.19%); 9,891 "Protestant" (64.19%); 43 Other (0.28%); 361 None (2.34%) | |
| First
Count: Joan Baird, (UUP) 1,438 Jim Walsh, (Ind) 809 William Bell, (UUP) 602 Cyril Vage, (DUP) 581 Mel Byrne, (SDLP) 534 Frank McQuaid, (Alliance) 423 Derick Bell, (UUP) 390 Ian Burns, (UUP) 359 |
Votes
by Party: UUP: 2,789 (54.3%), 3 seats DUP: 581 (11.3%), 1 seat SDLP: 534 (10.4%), 1 seat Alliance: 423 (8.2%) Ind: 809 (15.8%), 1 seat |
| Electorate:
10,351; seats: 6; votes cast: 5,215; spoilt votes: 79
(1.5%); valid votes: 5,136 (98.5%); quota: 734 |
| First Count: James Walsh, (SDLP) 1,186 Kathleen Joan Baird, (UUP) 1,352 Archie McKelvey, (UUP) 722 John Forsythe Dobson, (UUP) 517 Ian Burns, (UUP) 507 Margaret Elizabeth Ellen Davis, (DUP) 353 Frank McQuaid, (Alliance) 289 |
Votes by Party: UUP: 3,098 (62.9%), 4 seats SDLP: 1,186 (24.1%), 1 seat DUP: 353 (7.2%) Alliance: 289 (5.8%), 1 seat |
| Electorate:
9,533; seats: 6; votes cast: 5,014; spoilt votes: 88
(1.8%); valid votes: 4,926 (98.2%); quota: 704 |
2011: **UUP
36%, **DUP 31%, *SDLP 12%, *Alliance 8%, SF 7%, Ind 6%
2005: **UUP 38%, **DUP 33%, *SDLP 20%, *Alliance 9%
2001: ***UUP 41%, *DUP 21%, *SDLP 20%, *Alliance 6%, Ind 6%,
UKUP 6%
1997: ***UUP 54%, *Ind 16%, *DUP 11%, *SDLP 10%, Alliance 8%
1993: ****UUP 63%, *SDLP 24%, DUP 7%, *Alliance 6%
| First
Count: Seamus Doyle, (SDLP) 1238 Elizabeth Ingram, (UUP) 1135 Brendan Curran, (SF) 1039 David Herron, (DUP) 869 John Hanna, (UUP) 691 Glenn Barr, (UUP) 672 Ian Wilson, (DUP) 621 Stephen Herron, (TUV) 209 |
Votes
by Party: UUP: 2,498 (38.6%), 3 seats DUP: 1,490 (23.0%), 1 seat SDLP: 1,238 (19.1%), 1 seat SF: 1,039 (16.0%), 1 seat TUV: 209 (3.2%) |
| Electorate:
11,012; seats: 6; votes cast: 6,579; spoilt votes: 105
(1.6%); valid votes: 6,474 (98.4%); quota: 925 |
| First
Count: Seamus Doyle, (SDLP) 1051 Stephen Herron, (DUP) 1026 John Ingram, (UUP) 878 Dessie Ward, (SF) 758 Wilfred McFadden, (DUP) 740 John Hanna, (UUP) 593 Malachy McCartan, (Ind) 498 Ian Wilson, (DUP) 449 John McCallister, (UUP) 386 David Griffin, (Alliance) 300 |
Votes
by Party: DUP: 2,215 (33.2%), 2 seats UUP: 1,857 (27.8%), 2 seats SDLP: 1,051 (15.7%), 1 seat SF: 758 (11.3%), 1 seat Ind: 498 (7.5%) Alliance: 300 (4.5%) |
| Electorate:
10,151; seats: 6; votes cast: 6,796; spoilt votes: 117
(1.7%); valid votes: 6,679 (98.3%); quota: 955 |
| First
Count: Seamus Doyle, (SDLP) 1,351 John Ingram, (UUP) 1,202 Wilfred McFadden, (DUP) 1,084 Malachy McCartan, (Ind) 768 Brendan Curran, (SF) 755 Stephen Herron, (DUP) 735 John Hanna, (UUP) 617 Violet Cromie, (UUP) 486 Stephen Briggs, (UKUP) 387 |
Votes
by Party: UUP: 2,305 (31.2%), 2 seats DUP: 1,819 (24.6%), 2 seats SDLP: 1,351 (18.3%), 1 seat SF: 755 (10.2%) UKUP: 387 (5.2%) Ind: 768 (10.4%), 1 seat |
| Electorate:
9,937; seats: 6; votes cast: 7,493; spoilt votes: 108
(1.4%); valid votes: 7,385 (98.6%); quota: 1,056 |
|
| 2001 Census: 5,172 "Catholic" (38.42%); 8,026 "Protestant" (59.62%); 29 Other (0.22%); 235 None (1.75%) | |
| First
Count: John Ingram, (UUP) 1,129 Wilfred McFadden, (DUP) 1,103 Seamus Doyle, (SDLP) 946 John Hanna, (UUP) 799 Violet Cromie, (UUP) 671 Malachy McCartan, (Ind) 692 Oliver Moore, (SDLP) 661 |
Votes
by Party: UUP: 2,599 (43.3%), 3 seats SDLP: 1,607 (26.8%), 1 seat DUP: 1,103 (18.4%), 1 seat Ind: 692 (11.5%), 1 seat |
| Electorate:
9,460; seats: 6; votes cast: 6,273; spoilt votes: 272
(4.3%); valid votes: 6,001 (95.7%); quota: 886 |
| First
Count: Seamus Doyle, (SDLP) 1,229 John Ingram, (UUP) 1,083 Wilfred McFadden, (DUP) 977 Violet Wilhelmina Cromie, (UUP) 782 Laurence Francis McCartan, (Ind) 732 John Leslie Hanna, (UUP) 672 Samuel George Walker, (UUP) 614 Liam McDermott, (SDLP) 339 |
Votes
by Party: UUP: 3,151 (49.0%), 3 seats SDLP: 1,568 (24.4%), 1 seat DUP: 977 (15.2%), 1 seat Ind: 732 (11.4%), 1 seat |
| Electorate:
9,323; seats: 6; votes cast: 6,535; spoilt votes: 107
(1.6%); valid votes: 6,428 (98.4%); quota: 919 |
2011: ***UUP
39%, *DUP 23%, *SDLP 19%, *SF 16%, TUV 3%
2005: **DUP 33%, **UUP 28%, *SDLP 16%, *SF 11%, Ind 8%, Alliance
5%
2001: **UUP 31%, **DUP 25%, *SDLP 18%, *Ind 10%, SF 10%, UKUP 5%
1997: ***UUP 43%, *SDLP 26%, *DUP 18%, *Ind 11%
1993: ***UUP 49%, *SDLP 24%, *DUP 15%, *Ind 11%
Pre-1993 results from Flackes and Elliott's Northern Ireland - a Political Directory
2011:
UUP 7, DUP 5, SDLP 2, SF 2, Alliance 1
2005: DUP 7, UUP 5, SDLP 3, SF 1, Alliance 1
2001: UUP 7, DUP 5, SDLP 3, Inds 1, Alliance 1
1997: UUP 9, SDLP 3, DUP 3, Inds 2
1993: UUP 10, SDLP 3, DUP 2, Ind 1, Alliance 1
1989: UUP 9, SDLP 3, DUP 2, Ind 1
1985: UUP 8, SDLP 3, DUP 3, Ind 1
1981: UUP 8, DUP 4, SDLP 2, Ind 1
1977: UUP 8, DUP 3, SDLP 2, Loy 1, Ind 1
1973: UUP 11, SDLP 1, Oth 3
NB: 17 councillors since 1993 election, 15 before that. Boundaries changed in 1985 and again in 1993.
Other sites based at ARK: ORB (Online Research Bank) | CAIN (Conflict Archive on the INternet) | Northern Ireland Life and Times Survey
Front Page | Site Map | Notes and Queries | Updates Mailing List | About this Site
Your comments,
please! Send an email to me at nicholas.whyte@gmail.com.
 |
This page has been developed with the support of a project grant from the New Initiatives Fund of the Electoral Commission. However, any views expressed on this page or, in particular, other pages of this website are those of the author and not necessarily shared by The Electoral Commission. |
Nicholas
Whyte, 7 May 2000; last updated 27 June 2011 by Conal Kelly.
|
Disclaimer:© Nicholas Whyte 1998-2004 Last
Updated on
Sunday, 21-Mar-2010
11:43
|