

| |
|
|
|
|
|
|
 |
| Maps and graph by Conal Kelly | |
 |
2019 Westminster notional result on new boundaries:
| DUP | UUP | Cons | APNI | PBP | SDLP | SF | Aontu | ||
| 2019 actual |
5,220 | 1,882 | 6,194 | 2,985 | 20,866 | 1,635 | |||
| 13.5% | 4.9% | 16.0% | 7.7% | 53.8% | 4.2% | ||||
| From West Belfast |
To West Belfast | 4,084 | 1,813 | 6,058 | 2,919 | 20,408 | 1,599 | ||
| From West Belfast | To North Belfast | -1071 | -45 | -57 | -28 | -195 | -16 | ||
| From West Belfast | To South Belfast and Mid Down |
-56 | -20 | -67 | -32 | -225 | -18 | ||
| From West Belfast | To South Antrim | -10 | -3 | -11 | -5 | -38 | -3 | ||
| From North Belfast | To West Belfast | 2,863 | 348 | 208 | |||||
| From Lagan Valley |
To West Belfast | 840 | 370 | 41 | 898 | 272 | 170 | ||
| From South Belfast | To West Belfast | 1 | 1 | 3 | 0 | ||||
| 2019 notional |
7,789 | 370 | 41 | 3,060 | 6,058 | 3,195 | 20,786 | 1,599 | |
| 18.2% | 0.9% | 0.1% | 7.1% | 14.1% | 7.4% | 48.5% | 3.7% | ||
| +4.7% | +0.9% | +0.1% | +2.3% | -1.8% | -0.2% | -5.3% | -0.5% |
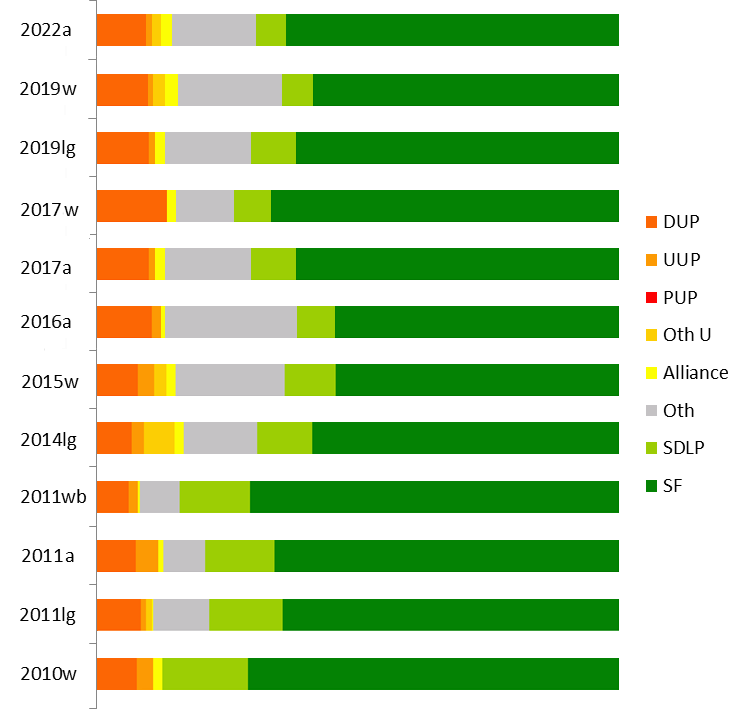
| DUP | UUP | Oth U | Alliance | Oth | PBPA | SDLP | SF | |
| 2024w | 10.8% |
1.2% |
5.1% |
2.7% |
3.8% |
12.7% |
10.9% |
52.9% |
| 2022a | 9.5% | 1.1% | 1.8% | 2.1% | 8.5% | 7.5% | 5.8% | 63.7% |
| 2019w | 13.5% | 4.9% | 4.2% | 16.0% | 7.7% | 53.8% | ||
| 2019lg | 9.8% | 1.0% | 2.2% | 2.5% | 7.3% | 12.6% |
6.0% | 58.7% |
| 2017w | 13.4% | 1.8% | 0.9% | 10.4% | 7.0% | 66.7% | ||
| 2017a | 10.1% | 1.2% | 1.9% | 1.6% | 14.9% | 8.6% | 61.8% | |
| 2016a | 10.4% | 1.8% | 0.8% | 2.4% | 22.9% | 7.3% | 54.5% | |
| 2015w | 7.8% | 3.1% | 2.3% | 1.8% | 1.7% | 19.2% |
9.8% | 54.2% |
| 2014lg | 7.1% | 2.4% | 6.2% | 2.0% | 9.4% | 5.4% |
11.2% | 62.5% |
| 2011wb |
6.1% | 1.7% | 0.5% | 7.6% |
13.5% | 70.6% | ||
| 2011a |
7.5% | 4.2% | 1.1% | 3.2% | 4.8% |
13.2% | 66.1% | |
| 2011lg | 8.6% | 0.9% | 1.1% | 0.2% | 11.0% | 14.2% | 65.1% | |
| 2010w | 7.6% | 3.1% | 1.9% | 16.4% | 71.1% | |||
| 2007a |
10.8% | 1.8% | 0.3% | 2.3% | 2.3% |
13.8% | 68.6% | |
| 2005w | 10.8% | 2.5% | 0.1% | 2.0% | 16.0% | 68.6% | ||
| 2005lg | 8.4% | 1.4% | 2.5% | 0.9% | 19.4% | 67.8% |
NB that the figures for elections before 2010 are
projections. Figures for the previous boundaries are at the bottom
of this page.
| Danny Baker (SF) 9,011 (20.6%) @Órlaithí Flynn (SF) 6,743 (15.4%) @Pat Sheehan (SF) 6,373 (14.6%) @Aisling Reilly (SF) 5,681 (13.0%) Frank McCoubrey (DUP) 4,166 (9.5%) @Gerry Carroll (PBP) 3,279 (7.5%) Paul Doherty (SDLP) 2,528 (5.8%) Gerard Herdman (Aontú) 1,753 (4.0%) Dan Murphy (IRSP) 1,103 (2.5%) Donnamarie Higgins (Alliance) 907 (2.1%) Jordan Doran (TUV) 802 (1.8%) Linsey Gibson (UUP) 474 (1.1%) Stevie Maginn (Green) 307 (0.7%) Patrick Crossan (WP) 193 (0.4%) Gerard Burns (Ind) 192 (0.4%) Tony Mallon (Ind) 129 (0.3%) Declan Hill (Ind) 26 (0.1%) @ member of the Assembly when it was dissolved. |
SF 27,808 (63.7%, +1.9%) 4 seats DUP 4,166 (9.5%, -0.6%) PBP 3,279 (7.5%, -7.4%) 1 seat SDLP 2,528 (5.8%, -2.8%) Aontú 1,753 (4.0%) IRSP 1,103 (2.5%) Alliance 907 (2.1%, +0.2%) TUV 802 (1.8%) UUP 474 (1.1%, -0.1%) Ind 347 (0.8%) Green 307 (0.7%, +0.1%) WP 193 (0.4%, -0.6%) Electorate: 68,727 Votes cast: 44,440 (64.7%, -2.1%), spoilt votes 773 (1.7%) Valid votes: 43,667, quota 7,278 |
No change in West Belfast. Sinn Fein once again demonstrated
precision vote management to return their four candidates; the
only such instance in Northern Ireland. People Before Profit
leader, Gerry Carroll, saw his vote halved and came within 532.40
votes of losing his seat to the DUP's Frank McCoubrey, though 515
undistributed SF surplus votes would have widened the gap. This
was both Sinn Fein's and People Before Profit's best result of the
election.
*Paul Maskey (SF) 20,866 (53.8%, -12.9%)
@Gerry Carroll (PBP) 6,194 (16.0%, +5.8%)
Frank McCoubrey (DUP) 5,220 (13.5%, +0.1%)
Paul Doherty (SDLP) 2,985 (7.7%, +0.7%)
Donnamarie Higgins (Alliance) 1,882 (4.9%, +3.1%)
Monica Digney (Aontú) 1,635 (4.2%, +4.2%)
* outgoing MP.
@ member of the Assembly.
Electorate: 65,644; Total Poll: 38,988 (59.4%); Invalid Votes:
206 (0.5%); Valid Votes: 38,782
Maskey was returned with an outright majority of the votes but
also the lowest tally for Sinn Fein in West Belfast since 1996.
PBP and to a lesser extent Alliance picked up some votes from SF.
Somewhat ironically, this is the only constituency where the DUP
vote share increased, albeit very modestly. In a five-seat
Assembly election, these votes would give Sinn Fein three seats
and one for People Before Profit. The last seat would likely go to
the DUP or SDLP; the latter being more transfer friendly.
From the 2011 census, West Belfast includes:
The entire Belfast DEA of Black Mountain
96% of the Belfast DEA of Collin
74% of the Belfast DEA of Court
and
2% of the Lisburn and Castlereagh DEA of Killultagh
With some adjustment for voter community background, I project the 2019 results as:
SF 19,938 (58.7%)
PBP 4,282 (12.6%)
DUP 3,333 (9.8%)
SDLP 2,053 (6.0%)
Aontú 1,415 (4.2%)
Alliance 854 (2.5%)
PUP 576 (1.7%)
Green 545 (1.6%)
UUP 339 (1.0%)
Inds 261 (0.8%)
WP 228 (0.7%)
TUV 160 (0.5%)
If cast in a five-seat STV election, those votes would certainly give SF three seats. The last two would be between the fourth Sinn Fein candidate, PBP and the DUP, with the DUP probably at a disadvantage.
Candidates:
*Paul Maskey (SF) 27,107 (66.7%, +12.5%)
Frank McCoubrey (DUP) 5,455 (13.4%, +5.6%)
@Gerry Carroll (PBP) 4,132 (10.4%, -8.8%)
Tim Attwood (SDLP) 2,860 (7.0%, -2.8%)
Sorcha Eastwood (Alliance) 731 (1.8%, ±0)
Conor Campbell (WP) 348 (0.9%, -0.8%)
* outgoing MP.
@ member of the Assembly
Electorate: 62,423; Total Poll: 40,830 (65.4%); Invalid Votes:
190 (0.4%); Valid Votes: 40,633
A strong result for SF, reclaiming ground from others. In a
five-seat Assembly election, these votes would deliver four SF
MLAs with People Before Profit probably best placed for the lsat,
with SDLP transfers.
| Órlaithí Flynn (SF) 6,918
(17.1%) @Alex Maskey (SF) 6,346 (15.7%) @Fra McCann (SF) 6,201 (15.4%) @Pat Sheehan (SF) 5,466 (13.5%) @Gerry Carroll (PBP) 4,903 (12.2%) Frank McCoubrey (DUP) 4,063 (10.1%) Alex Attwood (SDLP) 3,452 (8.6%) Michael Collins (PBP) 1,096 (2.7%) Sorcha Eastwood (Alliance) 747 (1.9%) Fred Rodgers (UUP) 486 (1.2%) Conor Campbell (WP) 415 (1.0%) Ellen Murray (Green) 251 (0.6%) |
SF 24,931 (61.8%, +7.3%) 4 seats PBP 5,999 (14.9%, -8.0%) 1 seat DUP 4,063 (10.1%, -0.3%) SDLP 3,452 (8.6%, +1.3%) 0 seats (-1) Alliance 747 (1.9%, +1.1%) UUP 486 (1.2%, -0.6%) WP 415 (1.0%, -0.5%) Green 251 (0.6%, -0.3%) Electorate: 61,309 Votes cast: 40,930 (66.8%, +9.0%), spoilt votes 586 (1.4%) Valid votes: 40,344, quota 6,725 |
Alex Attwood of the SDLP was eliminated on the second count, 353
votes behind the DUP's McCoubrey; if it had been the other way
round, Attwood would likely had profited from Unionist transfers
to stay in the runnnig. As it was, McCoubrey lost the last seat by
a margin of 1,382 to SF's Sheehan, and 846 undistributed SF
surplus votes would certtainly have widened the gap.
| Gerry Carroll (PBP) 8,299 Alex Maskey (Sinn Féin) 4,769 Jennifer McCann (Sinn Féin) 4,386 Fra McCann (Sinn Féin) 4,028 Frank McCoubrey (DUP) 3,766 Pat Sheehan (Sinn Féin) 3,516 Rosie McCorley (Sinn Féin) 3,053 Alex Attwood (SDLP) 2,647 Gareth Martin (UUP) 654 Conor Campbell (WP) 532 Ellen Murray (Green) 327 Jemima Higgins (Alliance) 291 |
Sinn Féin 19,752 (54.5%, -11.6%) 4 seats
(-1) PBP 8,299 (22.9%, +18.1%) 1 seat (+1) DUP 3,766 (10.4%, +2.9%) SDLP 2,647 (7.3%, -5.9%) 1 seat UUP 654 (1.8%, -2.4%) WP 532 (1.5%, -0.2%) Green 327 (0.9%) Alliance 291 (0.8%, -0.3%) Electorate 63,993 Votes cast 36,990 (57.8%, -0.1%); spoilt 722 (2.0%) Valid votes: 36,268; quota 5,182 |
A triumph for Gerry Carroll, elected on the first count with 1.6
quotas; and a very narrow squeak for Alex Attwood of the SDLP, who
trailed Frank McCoubrey of the DUP for most of the count and
pulled ahead only by 88.99 votes on the very last transfer of SF
surplus votes.
*Paul Maskey (SF) 19,163 (54.2%, -16.8%)
Gerry Carroll (PBP) 6,798 (19.2%)
Alex Attwood (SDLP) 3,475 (9.8%, -6.5%)
Frank McCoubrey (DUP) 2,773 (7.8%, +0.3%)
Bill Manwaring (UUP) 1,088 (3.1%, 0.0%)
Brian Higginson (UKIP) 765 (2.2%)
Gerard Catney (Alliance) 636 (1.8%, -0.1%)
John Lowry (WP) 597 (1.7%)
Paul Shea (Conservative) 34 (0.1%)
Electorate: 62,697; Total Poll: 35,610 (56.8%); Invalid Votes: 281
(0.8%); Valid Votes: 35,329
A solid defence by Maskey, though this is the worst SF performance in West Belfast since 1996. Having said that, the Conservative candidate, who got less than 0.1% of the vote, has achieved a new record for poor performances by a mainstream party.
If cast in a six-seat Assembly election, these votes would give
SF four seats, PBP one and probably the SDLP one.
From the 2011 census, West Belfast includes:
The entire Belfast DEA of Black Mountain
96% of the Belfast DEA of Collin
74% of the Belfast DEA of Court
and
2% of the Lisburn and Castlereagh DEA of Killultagh
With some adjustment for voter community background, I project
the 2014 results as:
SF 19520 (62%)
SDLP 3508 (11%)
DUP 2223 (7%)
Éirígí 1751 (6%)
PBP 1691 (5%)
PUP 1414 (5%)
UUP 760 (2%)
Alliance 622 (2%)
NI21 588 (2%)
TUV 520 (2%)
WP 377 (1%)
RNU 208 (1%)
Inds 13 (0.4%)
| @Paul Maskey (SF) 5,343 (15.4%) @Jennifer McCann (SF) 5,239 (15.1%) @Fra McCann (SF) 4,481 (12.9%) @Sue Ramsey (SF) 4,116 (11.9%) @Alex Attwood (SDLP) 3,765 (10.9%) @Pat Sheehan (SF) 3,723 (10.7%) Brian Kingston (DUP) 2,587 (7.5%) Gerry Carroll (PBP) 1,661 (4.8%) Bill Manwaring (UUP) 1,471 (4.2%) Colin Keenan (SDLP) 802 (2.3%) John Lowry (WP) 586 (1.7%) Pat Lawlor (Socialist) 384 (1.1%) Dan McGuinness (Alliance) 365 (1.1%) Brian Pelan (Independent) 122 (0.4%) @ member of the Assembly when it was dissolved. |
SF 22,902 (66.1%, -3.8%) 5 seats SDLP 4,567 (13.2%, +1.0%) 1 seat DUP 2,587 (7.5%, -3.3%) PBP 1,661 (4.8%) UUP 1,471 (4.2%, +2.5%) WP 586 (1.7%, +0.4%) Socialist 384 (1.1%) Alliance 365 (1.1%, +0.7%) Independent 122 (0.4%) Electorate 61,520 Votes cast 35,618 (57.9%); spoilt 970 (2.7%) Valid votes: 34,648; quota 4,951 |
Looking at the first preferences, I had the idea
that the 11.7% total Unionist vote might float ahead of the SF
candidates, especially given the relative difficulty of ensuring
that Gerry Carroll's voters would be sufficiently disciplined for
the convenience of the Shinners' battle plan. But in the end, if
you have enough votes, balancing doesn't matter, and SF had enough
votes to keep all five seats, the SDLP retaining the sixth, Pat
Sheehan of SF finishing 460 votes ahead of the DUP.
*@Gerry Adams (Sinn Féin)
22,840 (71.1%, +3.5%)
@Alex Attwood (SDLP) 5,261 (16.4%, +0.4%)
William Humphrey (DUP) 2,436 (7.6%, -3.2%)
Bill Manwaring (UCUNF) 1,000 (3.1% +0.6%)
Maire Hendron (Alliance) 596 (1.9% , +1.8%)
Electorate: 59,522; Total Poll: 32,682 (54.9%); Invalid Votes: 549
(1.7%); Valid Votes: 32,133
* incumbent
@ elected to the Northern Ireland Assembly from this constituency
A solid performance from SF in their strongest seat. If those votes were cast in a six-seat Assembly election, SF would probably keep their five seats and the SDLP would retain their seat also.
| *Gerry Adams MP (SF) 6029
(17.8%) +Sue Ramsey (SF) 4715 (14.0%) Paul Maskey (SF) 4368 (12.9%) Jennifer McCann (SF) 4265 (12.6%) *Fra McCann (SF) 4254 (12.6%) *Diane Dodds (DUP) 3661 (10.8%) *Alex Attwood (SDLP) 3036 (9.0%) Margaret Walsh (SDLP) 1074 (3.2%) Seán Mitchell (People Before Profit Alliance) 774 (2.3%) Louis West (UUP) 558 (1.7%) John Lowry (WP) 434 (1.3%) Geraldine Taylor (RSF) 427 (1.3%) Daniel McGuinness (Alliance) 127 (0.4%) Rainbow George (Make Politicians History) 68 (0.2%) *Elected in 2003 from West Belfast +Appointed to 2003-07 Assembly to fill a vacancy |
SF 23,631 (69.9%, +4.9%) 5
seats (+1) SDLP 4,110 (12.2%, -6.9%) 1 seat DUP 3,661 (10.8%, +3.1%) (-1) People Before Profit 774 (2.3%) UUP 558 (1.7%, -1.9%) WP 434 (1.3%, +0.05%) RSF 427 (1.3%) Alliance 127 (0.4%, +0.1%) Rainbow George 68 (0.2%) Electorate 50,792 Votes cast 34,238 (67.4%); spoilt votes 448 (1.3%) Valid votes 33,790; quota 4,828 |
*@ Gerry Adams (Sinn Fein) 24,348 (70.5%, +4.4%)
@Alex Attwood (SDLP) 5,033 (14.6%, -4.3%)
@Diane Dodds (DUP) 3,652 (10.6%, +4.2%)
@Chris McGimpsey (UUP) 779 (2.3% -3.9%)
John Lowry (WP) 432 (1.3% -0.5%)
Lynda Gilby (Vote for Yourself Rainbow Dream Ticket) 154 (0.4%,
+0.2%)
Liam Kennedy (Independent) 147 (0.4%)
Valid Turnout 34,545 (64.2%)
* outgoing MP
@ member of the Assembly
If cast in a six-seat STV election, these votes would put SF within spitting distance of five seats with the SDLP picking up the last. Any vote leakage from SF would increase the chances of the DUP winning a seat.
Sinn Fein 22,659.8 (66.1%) - Best SF equivalent result in
Northern Ireland
SDLP 5,751.9 (16.8%)
DUP 3,841.6 (11.2%)
UUP 739.9 (2.2%)
PUP 479.4 (1.4%)
WP 314 (0.9%)
Independents 476.4 (1.4%)
Extrapolating from the local government elections is tricky because the West Belfast constituency breaches two local electoral area boundaries. If we make some reasonable adjustments, we get these figures for the whole West Belfast constituency. Sinn Fein would certainly have won four seats, the SDLP one, and the DUP one. However I have divided the votes from the Dunmurry Cross DEA as if they were homogenously spread, when in fact it is likely that the SF vote is concentrated in the part of Dunmurry Cross inside West Belfast, so they are probably closer to the fifth seat (at the expense of the DUP) than these figures would suggest.
| *Gerry Adams
(SF) 6199 (18.9%) Fra McCann (SF) 4263 (13.0%) *Bairbre De Brun (SF) 4069 (12.4%) Michael Ferguson (SF) 3849 (11.7%) *Alex Attwood (SDLP) 3667 (11.2%) *Sue Ramsey (SF) 2988 (9.1%) *Joe Hendron (SDLP) 2583 (7.9%) Diane Dodds (DUP) 2544 (7.7%) Chris McGimpsey (UUP) 1170 (3.6%) Hugh Smyth (PUP) 813 (2.5%) John Lowry (WP) 407 (1.2%) John MacVicar (Ind) 211 (0.6%) Kathryn Ayers (Alliance) 75 (0.2%) David Kerr (Ulster Third Way) 16 (0.0%) |
SF 21,368 (65.0%, +6.0%) 4
seats Best result for SF in Northern Ireland SDLP 6,250 (19.0%, -5.9%) 1 seat DUP 2,544 (7.7%, +4.5) 1 seat UUP 1,170 (3.6%, -0.3%) PUP 813 (2.5%, -2.7%) WP 407 (1.2%, -0.3%) Best result for WP in Northern Ireland Ind 211 (0.6%) Alliance 75 (0.2%, -0.10) UTW 16 (0.0%) Electorate 50,861 |
Reaction:Vote management is difficult when you have a lot of candidates. A more even split between McCann and Ramsey would have seen both elected, and SF taking five out of six. As it was Dodds sneaked in by 87 votes, the closest inter-party race of the election. De Brun resigned from the Assembly after her election to the European Parliament in 2004, and was replaced by Ramsay who had lost out so narrowly. Ferguson died in September 2006; as of the last update to this page, his seat was still vacant.
West Belfast had lost 18.56% of its electorate, more than any other constituency, in the great electoral register shake-out, varying from 25.14% in the Falls ward of Belfast to 11.87% in Highfield, also in Belfast.* outgoing MP
@ member of the Assembly
A good result for SF; Adams got the highest vote in both absolute and percentage terms of any candidate in Northern Ireland. If this vote was repeated in a six-seat Assembly election, Sinn Fein would probably win five seats, and the SDLP would get the other one.
SF 24358.4 (60%) Best equivalent result in Northern Ireland
SDLP 7913.1 (20%)
DUP 2515 (6%)
UUP 2235.1 (6%)
PUP 1289.4 (3%)
WP 488 (1%) Best equivalent result in Northern Ireland
NIWC 365 (1%)
Alliance 136 (0.3%)
Ulster Third Way 16.8 (0.04%) Best equivalent result in
Northern Ireland
Independents 1163.8 (3%)
Extrapolating from the local government elections is tricky because the West Belfast constituency breaches two local electoral area boundaries. If we make some reasonable adjustments, we get these figures for the whole West Belfast constituency. Sinn Fein would certainly have won four seats, and the SDLP one. There would have been one Unionist seat, with the DUP best placed to win it. However I have divided the votes from the Dunmurry Cross DEA as if they were homogenously spread, when in fact it is likely that the SF vote is concentrated in the part of Dunmurry Cross inside West Belfast.
| *Gerry Adams (SF) 9,078
*Joe Hendron (SDLP) 6,140 Bairbre De Brun (SF) 4,711 *Alex Maskey (SF) 4,330 Alex Attwood (SDLP) 4,280 Sue Ramsey (SF) 3,946 Michael Ferguson (SF) 2,585 #Hugh Smyth (PUP) 2,180 Chris McGimpsey (UUP) 1,640 Margaret Ferris (DUP) 1,345 Thomas Dalzell-Sheridan (UKUP) 666 John Lowry (WP) 607 Dan McGuinness (All) 129 Mary Cahillane (Pro-Agreement Socialist) 128 Michael Kennedy (NLP) 29 |
SF 24,650 (58.98%) 4 seats
Best result for SF in Northern Ireland SDLP 10,420 (24.93%) 2 seats PUP 2,180 (5.22%) UUP 1,640 (3.92%) DUP 1,345 (3.22%) UKU 666 (1.59%) WP 607 (1.45%) Alliance 129 (0.31%) Soc 128 (0.31%) NLP 29 (0.07%) Electorate: 60,669 |
* elected in 1996 Forum/talks election from West Belfast
# elected in 1996 Forum/talks election as a 'top-up' candidate.
A strong result for Sinn Féin in their strongest constituency. The failure of even one Unionist candidate to win a seat is not all that surprising given recent voting patterns. Attwood finished with 5,350 votes and 350 surplus votes from SinnFéin yet to be transferred, while McGimsey on 4,838 was still some way behind.
West Belfast had the highest percentage of spoilt votes in Northern Ireland at this election.
Sinn Féin 21,544.5 (59%) Best equivalent result for SF in
Northern Ireland
Social Democratic and Labour Party 6,241.5 (17%)
Ulster Unionist Party 2,442.3 (7%)
Progressive Unionist Party 1,842 (5%)
Democratic Unionist Party 1,387.6 (4%)
Alliance Party of Northern Ireland 889.4 (2%)
Ulster Democratic Party 720 (2%)
Workers Party 674 (2%)
Independent 251 (1%)
Independent Unionist 244.2 (1%)
Women's Coalition 90 (0.25%)
Total valid 36,326.5 (58.82%)
* Outgoing MP
ƒ Member of the Forum
Sinn Féin (SF) 22,355 (53%); 4 seats (Gerry Adams, Dodie
McGuinness, Alex Maskey, Annie Armstrong) Best result for SF
in Northern Ireland
Social Democratic and Labour Party (SDLP) 11,087 (26%); 1 seat
(Joe Hendron)
Progressive Unionist Party 1,982 (5%)
Democratic Unionist Party (DUP) 1,769 (4%)
Ulster Unionist Party (UUP) 1,489 (4%)
Workers Party (WP) 984 (2%)
Ulster Democratic Party (UDP) 848 (2%)
Alliance Party of Northern Ireland (APNI) 340 (1%)
Labour (Lab) 319 (1%)
Northern Ireland Women's Coalition (NIWC) 252 (1%)
Green Party 156 (0.37%)
Conservative Party (Con) 60 (0.14%)
Ulster Independence Movement (UIM) 43 (0.10%)
Democratic Left (DL) 37 (0.09%)
Independent Democratic Unionist Party 36 (0.09%)
Natural Law Party (NLP) 30 (0.07%)
Communist Party of Ireland (CP) 28 (0.07%)
Ulster's Independent Voice (UIV) 26 (0.06%)
Independent Chambers 12 (0.03%)
Electorate: 61,344; votes cast: 42,026 (68.5%); spoilt votes: 173 (0.4%); valid votes: 41,853
Hendron had been elected to the 1975 Convention, and both Hendron and Adams to the 1982 Assembly, from West Belfast.
| DUP | UUP | PUP | Oth U | Alliance | Oth | SDLP | SF | |
| 2007a |
11% | 2% | 0% | 5% | 12% | 70% | ||
| 2005w | 11% | 2% | 2% | 15% | 70% | |||
| 2005lg | 11% | 2% | 1% | 2% | 17% | 66% | ||
| 2003a | 8% | 4% | 2% | 1% | 0% | 1% | 19% | 65% |
| 2001w | 6% | 6% | 2% | 19% | 66% | |||
| 2001lg | 6% | 6% | 3% | 0% | 5% | 20% | 60% | |
| 1998a | 3% | 4% | 5% | 2% | 0% | 2% | 25% | 59% |
| 1997lg | 4% | 7% | 5% | 3% | 2% | 3% | 17% | 59% |
| 1997w | 3% | 2% | 39% | 56% | ||||
| 1996f | 4% | 4% | 4% | 2% | 1% | 4% | 26% | 53% |
See also: Full 1998 results from West Belfast | The Boundary Commission's Provisional Recommendations | Boundary Commission 2003 | Jim Riley's analysis of votes and seats in the 1998 Assembly election | The constituencies
Other sites based at ARK: ORB (Online Research Bank) | CAIN (Conflict Archive on the INternet) | Northern Ireland Life and Times Survey
Your comments, please! Send an email to me at nicholas.whyte@gmail.com.
 |
This page has been developed with the support of a project grant from the New Initiatives Fund of the Electoral Commission. However, any views expressed on this page or, in particular, other pages of this website are those of the author and not necessarily shared by The Electoral Commission. |
Nicholas Whyte, 3 June 1998; last updated 7 May 2022 by Conal Kelly.
|
|
Disclaimer:� Nicholas Whyte 1998-2015
|