

| |
|
|
|
|
|
|
 |
| Map and graph by Conal Kelly | |
This constituency takes in a large part of Antrim
and Newtownabbey District Council. The member of parliament
is Robin Swann (UUP); in 2024 he defeated Paul Girvan (DUP), who
had defeated Danny Kinahan (UUP) in 2017. Kinahan had defearted
William McCrea (DUP) in 2015; McCrea first won the seat from the September 2000 by-election until the 2001
general election, and again from 2005, David Burnside (UUP)
holding it in between. Before his death in 2000 the MP was
Clifford Forsythe (UUP), who had represented the constituency
since it was revised in 1983.
The DUP hold two Assembly seats here, and the UUP, Alliance and
Sinn Fein one each. See also 1983-1992 South
Antrim results, 1973-82 South Antrim
results and 1950-1970 South Amtrim
results.
2019 Westminster notional result on new boundaries:
DUP 15,432 (36.2%)| DUP | UUP | Cons | Alliance | PBP | SDLP | SF | Aontu | ||
| 2019 actual |
15,149 | 12,460 | 8,190 | 2,288 | 4,887 | ||||
| 35.3% | 29.0% | 19.1% | 5.3% | 11.4% | |||||
| From South Antrim |
To South Antrim | 14,937 | 12,283 | 7,597 | 2,088 | 4,603 | |||
| From South Antrim | To North Belfast |
-157 | -132 | -563 | -192 | -267 | |||
| From South Antrim | To East Antrim | -55 | -45 | -30 | -8 | -18 | |||
| From East Antrim | To South Antrim | 229 | 74 | 14 | 138 | 12 | 29 | ||
| From North Belfast |
To South Antrim | 169 | 38 | 184 | |||||
| From Lagan Valley |
To South Antrim | 88 | 39 | 4 | 59 | 8 | 5 | ||
| From West Belfast |
To South Antrim | 10 | 3 | 11 | 5 | 38 | 3 | ||
| 2019 notional |
15,432 | 12,396 | 18 | 7,836 | 11 | 2,113 | 4,858 | 3 | |
| 36.2% | 29.1% | 0.0% | 18.4% | 0.0% | 5.0% | 11.4% | 0.0% | ||
| +0.9% | +0.1% | - | -0.7% | - | -0.4% | - | - |
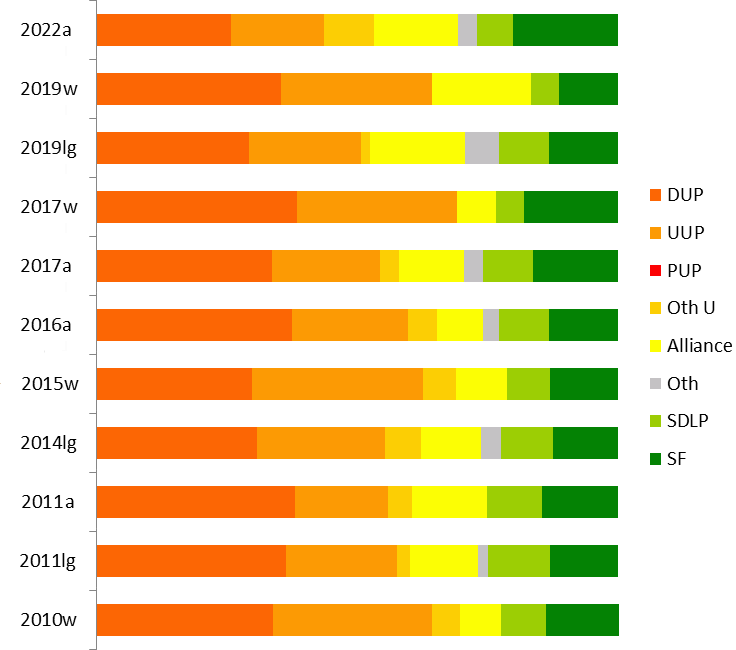
| DUP | UUP | Oth U | Alliance | Oth | SDLP | SF | |
| 2024w | 20.5% |
38.0% |
6.3% |
10.7% |
2.2% |
3.7% |
18.7% |
| 2022a | 25.9% | 17.9% | 9.6% | 16.0% | 3.7% | 6.9% | 20.1% |
| 2019w | 35.3% | 29.0% | 19.1% | 5.3% | 11.4% | ||
| 2019lg |
29.2% | 21.5% | 1.8% | 18.2% | 6.4% | 9.5% | 13.4% |
| 2017w | 38.2% | 30.8% | 7.4% | 5.5% | 18.1% | ||
| 2017a |
33.7% | 20.8% | 3.7% | 12.5% | 3.6% | 9.5% | 16.3% |
| 2016a |
37.5% | 22.2% | 5.6% | 8.9% | 3.1% | 9.6% | 13.2% |
| 2015w | 30.1% | 32.7% | 6.3% | 9.8% | 8.2% | 12.9% | |
| 2014lg |
31.0% | 24.4% | 7.0% | 11.4% | 3.8% | 10.1% | 12.3% |
| 2011a | 38.3% | 17.8% | 4.7% | 14.2% | 10.6% | 14.5% | |
| 2011lg |
37.0% | 21.5% | 2.5% | 13.3% | 1.8% | 12.1% | 13.1% |
| 2010w | 33.9% | 30.4% | 5.4% | 7.7% | 8.7% | 13.9% | |
| 2007a |
36.2% | 21.0% | 2.4% | 12.8% | 1.9% | 10.2% | 15.4% |
| 2005w | 40.3% | 29.6% | 8.3% | 11.2% | 10.7% | ||
| 2005lg | 38.3% | 25.9% | 1.5% | 7.4% | 3.4% | 13.6% | 9.9% |
NB that the figures for elections before 2010 are projections.
Figures for the previous boundaries can be found at the bottom of
this page.
NB also that the Conservatives got 0.3% in 2007 (on the old
boundaries) and supported the UUP in 2010 and 2011.
| @Declan Kearney (SF)
9,185 (20.1%) @John Blair (Alliance) 7,315 (16.0%) @Pam Cameron (DUP) 6,899 (15.1%) @Steve Aiken (UUP) 5,354 (11.7%) @Trevor Clarke (DUP) 4,943 (10.8%) Mel Lucas (TUV) 4,371 (9.6%) Roisin Lynch (SDLP) 3,139 (6.9%) Paul Michael (UUP) 2,821 (6.2%) Róisín Bennett (Aontú) 657 (1.4%) Lesley Veronica (Green) 539 (1.2%) Andrew Moran (Ind) 262 (0.6%) Jerry Maguire (PBP) 251 (0.5%) @ member of the Assembly when it was dissolved. |
DUP 11,842 (25.9%,
-7.8%) 2 seats SF 9,185 (20.1%, +3.8%) 1 seat UUP 8,175 (17.9%, -2.9%) 1 seat Alliance 7,315 (16.0%, +3.5%) 1 seat TUV 4,371 (9.6%, +6.4%) SDLP 3,139 (6.9%, -2.6%) Aontú 657 (1.4%) Green 539 (1.2%, ±0%) Ind 262 (0.6%) PBP 251 (0.5%, -0.8%) Electorate: 76,950 Votes cast: 46,195 (60.0%, -2.4%), spoilt votes 459 (1.0%) Valid votes: 45,736, quota 7,623 |
*Paul Girvan (DUP) 15,149 (35.3%, -3.0%)
Danny Kinahan (UUP) 12,460 (29.0%, -1.8%)
@John Blair (Alliance) 8,190 (19.1%, +11.6%)
@Declan Kearney (SF) 4,887 (11.4%, -6.7%)
Roisin Lynch (SDLP) 2,288 (5.3%, -0.1%)
* outgoing MP.
@ member of the Assembly.
Electorate: 71,711; Total Poll: 43,188 (60.2%); Invalid Votes:
214 (0.5%); Valid Votes: 42,974
Solid defense from the incumbent. Alliance making big gains, but
unusually more from SF than from Unionists. One of only three
seats where UUP have finished ahead of Alliance. In a five-seat
Assembly election, these votes would give the DUP two seats and
one each for the UUP and Alliance. The last seat would be between
a second UUP seat and SF; depending on SDLP and Alliance
transfers.
From the 2011 census, South Antrim includes:
The entire Antrim and Newtownabbey DEA of Airport
The entire Antrim and Newtownabbey DEA of Antrim
The entire Antrim and Newtownabbey DEA of Ballyclare
The entire Antrim and Newtownabbey DEA of Dunsilly
42% of the Antrim and Newtownabbey DEA of Three Mile Water
33% of the Antrim and Newtownabbey DEA of Glengormley Urban
3% of the Antrim and Newtownabbey DEA of Macedon
and
30% of the Lisburn and Castlereagh DEA of Killultagh
With some adjustment for voter community background, I project
the 2019 results as:
DUP 10,245 (29.2%)
UUP 7,517 (21.5%)
Alliance 6,831 (18.2%)
SF 4,705 (13.4%)
SDLP 3,319 (9.5%)
Inds 2,135 (6.1%)
TUV 467 (1.3%)
UKIP 159 (0.5%
Green 113 (0.3%)
@Paul Girvan (DUP) 16,508 (38.2%, +7.1%)
*Danny Kinahan (UUP) 13,300 (30.8%, -1.9%)
@Declan Kearney (SF) 7,797 (18.1%, +5.2%)
Neil Kelly (Alliance) 3,203 (7.4%, -2.4%)
Roisin Lynch (SDLP) 2,362 (5.5%, -2.7%)
* outgoing MP.
@ member of the Assembly.
Electorate: 68,244; Total Poll: 43,292 (63.4%); Invalid Votes:
122 (0.3%); Valid Votes: 43,170
One of the DUP's gains in the election; Kinahan improved the UUP
vote by over a thousand, but the DUP gained more than 5,500. If
cast in a five-member Assembly election, these votes would elect
two MLAs from the DUP and UUP, and one from Sinn Fein.
| @Declan Kearney (SF)
6,891 (16.3%) @Stephen Aiken (UUP) 6,287 (14.8%) @David Ford (Alliance) 5,278 (12.5%) @Paul Girvan (DUP) 5,152 (12.2%) @Pam Cameron (DUP) 4,604 (10.9%) @Trevor Clarke (DUP) 4,522 (10.7%) Roisin Lynch (SDLP) 4,024 (9.5%) Adrian Cochrane-Watson (UUP) 2,505 (5.9%) Richard Cairns (TUV) 1,353 (3.2%) Ivanka Antova (PBP) 530 (1.3%) David Mcmaster (Ind) 503 (1.2%) Eleanor Bailey (Green) 501 (1.2%) Mark Logan (Con) 194 (0.5%) @ member of the Assembly when it was dissolved. |
DUP 14,278 (33.7%,
-3.8%) 2 seats (-1) UUP 8,792 (20.8%, -1.4%) 1 seat SF 6,891 (16.3%, +3.1%) 1 seat Alliance 5,278 (12.5%, 3.6%) 1 seat SDLP 4,024 (9.5%, -0.1%) TUV 1,353 (3.2%, -0.6%) PBP 530 (1.3%) Ind 503 (1.2%) Green 501 (1.2%, -0.5%) Con 194 (0.5%, +0.3%) Electorate: 68,475 Votes cast: 42,726 (62.4%, +11.4%), spoilt votes 382 (0.9%) Valid votes: 42,344, quota 7,058 |
| @Paul Girvan (DUP) 5,014
(14.3%) Declan Kearney (Sinn Féin) 4,632 (13.2%) @Pam Cameron (DUP) 4,589 (13.1%) @Trevor Clarke (DUP) 3,585 (10.2%) Roisin Lynch (SDLP) 3,366 (9.6%) Stephen Aiken (UUP) 3,280 (9.3%) @David Ford (Alliance) 3,119 (8.9%) Paul Michael (UUP) 2,565 (7.3%) @Adrian Cochrane-Watson (UUP) 1,947 (5.5%) Richard Cairns (TUV) 1,318 (3.8%) Helen Farley (Green) 589 (1.7%) Robert Hill (UKIP) 574 (1.6%) David McMaster (Independent) 483 (1.4%) Mark Young (Conservative) 72 (0.2%) @ member of the Assembly when it was dissolved. |
DUP 13,188 (37.5%, -0.8%)
3 seats UUP 7,792 (22.2%, +4.4%) 1 seat Sinn Féin 4,632 (13.2%, -1.3%) 1 seat SDLP 3,366 (9.6%, -1.0%) Alliance 3119 (8.9%, -5.6%) 1 seat TUV 1318 (3.8%, +0.4%) Green 589 (1.7%) UKIP 574 (1.6%) Independent 483 (1.4%) Conservatives 72 (0.2%) Electorate 69,680 Votes cast 35,544 (51.0%); spoilt votes 411 (1.2%) Valid votes 35,133; quota 5,020 |
Danny Kinahan (UUP) 11,942 (32.7%, +2.3%)
*William McCrea (DUP) 10,993 (30.1%, -3.8%)
Declan Kearney (SF) 4,699 (12.9%, -1.0%)
Neil Kelly (Alliance) 3,576 (9.8%, +2.1%)
Roisin Lynch (SDLP) 2,990 (8.2%, -0.5%)
Richard Cairns (TUV) 1,908 (5.2%, -0.2%)
Alan Dunlop (Conservative) 415 (1.1%)
Electorate: 67,425; Total Poll: 36,734 (54.5%); Invalid Votes: 211
(0.6%); Valid Votes: 36,523
This was the first seat to change hands on election night in the
entire UK, Kinahan signalling a good evening for the UUP by
regaining their most winnable seat.
In a six-seat Assembly election, these votes would give the DUP
and UUP two seats, and SF and Alliance one.
From the 2011 census, South Antrim includes:
The entire Antrim and Newtownabbey DEA of Airport
The entire Antrim and Newtownabbey DEA of Antrim
The entire Antrim and Newtownabbey DEA of Ballyclare
The entire Antrim and Newtownabbey DEA of Dunsilly
42% of the Antrim and Newtownabbey DEA of Three Mile Water
33% of the Antrim and Newtownabbey DEA of Glengormley Urban
3% of the Antrim and Newtownabbey DEA of Macedon
With some adjustment for voter community background, I project the
2014 results as:
DUP 9197 (31%)
UUP 7246 (24%)
SF 3660 (12%)
Alliance 3390 (11%)
SDLP 2987 (10%)
TUV 1584 (5%)
NI21 973 (3%)
PUP 505 (2%)
Inds 143 (0.5%)
If cast in a six-seat STV election, those votes would certainly
give the DUP and UUP two seats and SF and Alliance one each.
| @Paul Girvan (DUP) 4,844 (15.1%) @Mitchel McLaughlin (SF) 4,662 (14.5%) @Trevor Clarke (DUP) 4,607 (14.3%) @David Ford (Alliance) 4,554 (14.2%) @Danny Kinahan (UUP) 3,445 (10.7%) @Thomas Burns (SDLP) 3,406 (10.6%) Pam Lewis DUP 2,866 8.9% Adrian Watson UUP 2,285 7.1% Mel Lucas TUV 1,091 3.4% Stephen Parkes BNP 404 1.3% @ member of the Assembly when it was dissolved. |
DUP 12,317 (38.3%, +2.1%)
3 seats (+1) UUP 5,730 (17.8%, -3.2%) 1 seat SF 4,662 (14.5%, -0.9%) 1 seat Alliance 4,554 (14.2%, +1.4%) 1 seat SDLP 3,406 (10.6%, +0.3%) (-1) TUV 1,091 (3.4%) BNP 404 (1.3%) Electorate 65,231 Votes cast 32,652 (50.1%); spoilt votes 488 (1.5%) Valid votes 32,164; quota 4,595 |
The SDLP's Burns lost his seat to the
DUP's Lewis by almost 1,100 votes, with many small surpluses
undistributed (67 from SF, 65 from Alliance, 361 more from the
DUP). This was really the result of boundary changes - I make the
SDLP's performance here an improvement on both 2010's Westminster
result and the adjusted 2007 figures, but it wasn't enough. The
UUP did not balance their candidates well, but did not have enough
votes in any case.
*@William McCrea (DUP) 11,536 (33.9%,
-6.4%)
%Reg Empey (UCUNF) 10,353 (30.4%, +0.8%)
@Mitchel McLaughlin (Sinn Féin) 4,729 (13.9%, +3.2%)
Michelle Byrne (SDLP) 2,955 (8.7% -2.5%)
Alan Lawther (Alliance) 2,607 (7.7%, -0.6%)
Melwyn Lucas (TUV) 1,829 (5.4%)
Electorate: 63,054; Total Poll: 34,143 (54.1%); Invalid Votes: 134
(0.4%); Valid Votes: 34,009
* incumbent
@ elected to the Northern Ireland Assembly from this constituency
% elected to the Northern Ireland Assembly from East Belfast
The DUP held what was on paper their most vulnerable seat, losing more votes to the TUV than to the UCUNF leader, who failed to make the necessary breakthrough. These votes, if cast in a six-seat Assembly election, would probably see the UUP gaining the SDLP's seat, though the Alliance seat is also vulnerable on these figures.
| &Mitchel McLaughlin
(SF) 6313 (16.5%) #William McCrea MP (DUP) 6023 (15.8%) *David Ford (Alliance) 5007 (13.1%) *David Burnside (UUP) 4507 (11.8%) Trevor Clarke (DUP) 4302 (11.3%) Mel Lucas (DUP) 2840 (7.4%) *Thomas Burns (SDLP) 2721 (7.1%) Danny Kinahan (UUP) 2391 (6.3%) Noreen McClelland (SDLP) 1526 (4.0%) Stephen Nicoll (UUP) 927 (2.4%) ^Robert McCartney (UKUP) 893 (2.3%) Pete Whitcroft (Green) 507 (1.3%) Stephen O'Brien (Conservative) 129 (0.3%) Marcella Delany (WP) 89 (0.2%) *Elected in 2003 from South Antrim ^Elected in 2003 from North Down #Elected in 2003 from Mid Ulster &Elected in 2003 from Foyle |
DUP 13,165 (34.5%, +3.9%) 2 seats UUP 7,825 (20.5%, -9.3%) 1 seat (-1) SF 6,313 (16.5%, +5.1%) 1 seat (+1) Alliance 5,007 (13.1%, +4.0%) 1 seat SDLP 4,247 (11.1%, -3.3%) 1 seat UKUP 893 (2.3%) Green 507 (1.3%) Conservative 129 (0.3%, -0.1%) WP 89 (0.2%) Electorate 63,654 Votes cast 38,481 (58.6%); spoilt votes 306 (0.8%) Valid votes 38,175; quota 5,454 |
@William McCrea (DUP) 14,507 (38.2% +3.4%)
*@David Burnside (UUP) 11,059 (29.1% -8.0%)
Noreen McClelland (SDLP) 4,706 (12.4% +0.3%)
Henry Cushinan (Sinn Fein) 4,407 (11.6% +2.2%)
@David Ford (Alliance) 3,278 (8.6% +4.1%)
* outgoing MP.
@Member of the Assembly
Given the narrow margin of Burnside's victory in 2001, and the overall trend, this should have come as no big surprise. If these votes were cast in a six-seat STV election, the DUP and UUP would have two seats each; much would depend on transfers, but the SDLP should get the fifth seat and Alliance would probably pull ahead of Sinn Fein to take the last.
The constituency comprises all 19 wards in Antrim, and 16 of the 25 wards in Newtownabbey (all 7 wards in the Antrim Line DEA, all 5 wards in the Ballyclare DEA, and 4 of the 7 wards in the University DEA [Ballyduff, Carnmoney, Hawthorne and Mossley]) Votes cast in 2005:
DUP 13,835 (37.3%)
UUP 9,165.1 (24.7%)
SDLP 5,254 (14.1%)
Sinn Fein 4,070 (11.0%)
Alliance 2,984.3 (8.0%)
Newtownabbey Ratepayers Assoc 631.4 (1.7%)
Independent 532 (1.4%)
United Unionist Coalition 315.4 (0.8%)
Conservative 235 (0.6%)
PUP 110.0 (0.3%)
Extrapolating from the local government elections is difficult because the South Antrim constituency breaches a local electoral area boundary. But if these votes were cast in an STV election, the DUP would have two seats and the UUP and SDLP one each for sure. The last two would be a tight scramble between Sinn Fein, the UUP and Alliance.
| David Burnside
(UUP) 7066 (18.9%) *Wilson Clyde (DUP) 5131 (13.7%) Paul Girvan (DUP) 4820 (12.9%) Martin Meehan (SF) 4295 (11.5%) *David Ford (Alliance) 3393 (9.1%) *Jim Wilson (UUP) 3135 (8.4%) Thomas Burns (SDLP) 2732 (7.3%) *Donovan McClelland (SDLP) 2671 (7.1%) John Smyth (DUP) 1501 (4.0%) Adrian Cochrane-Watson (UUP) 953 (2.5%) *Norman Boyd (NIUP) 774 (2.1%) Joan Cosgrove (NIWC) 465 (1.2%) Kenneth Wilkinson (PUP) 311 (0.8%) Jason Docherty (Cons) 174 (0.5%) |
DUP 11,452 (30.6%, +10.5%) 2
seats UUP 11,154 (29.8%, -0.1%) 2 seats SDLP 5,403 (14.4%, -3.3%) 1 seat SF 4,295 (11.5%, +4.2%) Alliance 3,393 (9.1%, +0.5%) 1 seat NIUP 774 (2.1%) Best result for NIUP in Northern Ireland NIWC 465 (1.2%, -1.3%) PUP 311 (0.8%, -2.7%) Con 174 (0.5%) Electorate 63,640 |
Reaction: An exceptional performance from Martin Meehan,
but it was not enough to get him in - there were enough Unionist
transfers around for David Ford to scrape home by 180 votes. The
DUP gained the seat won by Norman Boyd in 1998.
South Antrim had lost 11.91% of its electorate in the great electoral register shake-out, varying from 19.24% in the Springfarm ward of Antrim to 7.38% in Shilvodan, also in Antrim. 13 constituencies lost fewer voters, 4 lost more.
Electorate: 70,651; votes cast: 44,354 (62.7%); spoilt votes: 196
(0.4%)
Valid votes: 44,158; UUP majority 1,011
* outgoing MP
@ Member of the Assembly
Burnside's reversal of the September 2000 by-election result was one piece of good news in what was otherwise a bad day for the UUP. In a six-seat Assembly election, these votes would probably give the UUP three seats, DUP two and SDLP one.
Votes cast in 2001 were as follows:
UUP 14693.6 (33%)
DUP 11091.1 (25%)
SDLP 6269 (14%)
SF 3986 (9%)
Alliance 3175.3 (7%)
NIUP 1119 (3%) Best equivalent result in Northern Ireland
PUP 909.4 (2%)
Community Candidates 895.4 (2%) Best equivalent result in
Northern Ireland
UUAP 741.1 (2%)
Newtownabbey Ratepayers Association 389 (1%)
NIWC 299 (1%)
Cons 169 (0.4%)
Ind 228 (1%)
These votes if cast in a six seat STV election would clearly have given the UUP and DUP two seats, with one going to the SDLP and the last between Alliance, a third Ulster Unionist, and SF.
@ Member of the Assembly
The by-election was caused by the death of sitting Westminster MP Clifford Forsythe.
If these votes had been cast in a six-seat STV election, the UUP and DUP wuld each have been sure of two seats, and the SDLP of one. The last would probably have gone to the UUP on Alliance transfers.
DUP majority of 822. The turnout was 43%.
| Jim Wilson (UUP) 6,691 *Wilson Clyde (DUP) 6,034 Norman Boyd (UKU) 4,360 *Donovan McClelland (SDLP) 4,309 Duncan Shipley-Dalton (UUP) 4,147 David Ford (Alliance) 3,778 Tommy Burns (SDLP) 3,474 Martin Meehan (SF) 3,226 Stuart Deignan (DUP) 2,816 *John Hunter (UUP) 2,337 Ken Wilkinson (PUP) 1,546 Joan Cosgrove (NIWC) 1,108 Oliver Frawley (Lab) 137 George Stidolph (NLP) 28 |
UUP 13,175 (29.95%) 2 seats DUP 8,850 (20.12%) 1 seat SDLP 7,783 (17.69%) 1 seat UKU 4,360 (9.91%) 1 seat Alliance 3,778 (8.59%) 1 seat SF 3,226 (7.33%) PUP 1,546 (3.51%) NIWC 1,108 (2.52%) Lab 137 (0.31%) NLP 28 (0.06%) Electorate: 69,426 |
* elected in 1996 Forum/talks election from South Antrim
The UKUP came from nowhere to take a seat, which otherwise would probably have gone to their allies the DUP, or else to the UUP. Ford finished with 5,655 votes to Tommy Burns' 4,948, with undistributed surpluses of 99 votes from McClelland and 95 votes from Boyd which would have slightly narrowed the gap.
Ulster Unionist Party 11,587.5 (40%)
Social Democratic and Labour Party 5,132 (18%)
Democratic Unionist Party 3,873 (13%)
Alliance Party of Northern Ireland 3,003 (10%)
Progressive Unionist Party 872.5 (3%)
Newtownabbey Ratepayers Association 834 (3%)
Ulster Democratic Party 704.5 (2%)
Sinn Féin 612 (2%)
UK Unionist Party 213 (1%)
Labour 106 (1%)
Others 1,832.5 (6%)
Total valid 28,766 (41.76% of electorate)
Ulster Unionist Party (UUP) 12,001 (30%); 2 seats (Peter King,
John Hunter elected)
Democratic Unionist Party (DUP) 9,549 (24%); 2 seats (Wilson
Clyde, Trevor Kirkland elected)
Social Democratic and Labour Party (SDLP) 6,025 (15%); 1 seat
(Donovan McClelland elected)
Alliance Party of Northern Ireland (APNI) 3,332 (8%)
Sinn Féin (SF) 2,149 (5%)
United Kingdom Unionist Party (UKU) 2,111 (5%)
Progressive Unionist Party (PUP) 1,697 (4%)
Ulster Democratic Party (UDP) 1,000 (3%)
Northern Ireland Women's Coalition (NIWC) 435 (1%)
Independent Templeton 250 (1%)
Conservative Party (Con) 246 (1%)
Labour (Lab) 236 (1%)
Green Party 197 (0.49%)
Democratic Left (DL) 119 (0.30%)
Democratic Partnership 105 (0.26%)
Workers Party (WP) 104 (0.26%)
Ulster Independence Movement (UIM) 89 (0.22%)
Independent McMullan 33 (0.08%)
Natural Law Party (NLP) 16 (0.04%)
Independent Chambers 3 (0.01%)
Electorate: 68,898; votes cast: 39,874 (57.8%); spoilt votes: 77 (0.1%); valid votes: 39,797
| DUP | UKUP | UUP | PUP | Oth U | Alliance | Oth | SDLP | SF | |
| 2007a |
34% | 2% | 20% | 0% | 13% | 2% | 11% | 17% | |
| 2005w | 38% | 29% | 9% | 12% | 12% | ||||
| 2005lg | 37% | 25% | 0% | 1% | 8% | 3% | 14% | 11% | |
| 2003a | 31% | 30% | 1% | 3% | 9% | 1% | 14% | 11% | |
| 2001w | 35% | 37% | 2% | 4% | 12% | 9% | |||
| 2001lg | 25% | 33% | 2% | 5% | 7% | 4% | 14% | 9% | |
| 2000 | 38% | 35% | 7% | 0% | 11% | 9% | |||
| 1998a | 20% | 10% | 30% | 4% | 9% | 3% | 18% | 7% | |
| 1997lg | 13% | 1% | 40% | 3% | 2% | 10% | 10% | 18% | 2% |
| 1997w | 57% | 9% | 12% | 1% | 16% | 6% | |||
| 1996f | 24% | 5% | 30% | 4% | 4% | 8% | 5% | 15% | 5% |
See also: Full 2003 results from South Antrim | Full 1998 results from South Antrim | The Boundary Commission's Provisional Recommendations | Boundary Commission 2003 | Jim Riley's analysis of votes and seats in the 1998 Assembly election | The constituencies
Other sites based at ARK: ORB (Online Research Bank) | CAIN (Conflict Archive on the INternet) | Northern Ireland Life and Times Survey
Your comments, please! Send an email to me at nicholas.whyte@gmail.com.
 |
This page has been developed with the support of a project grant from the New Initiatives Fund of the Electoral Commission. However, any views expressed on this page or, in particular, other pages of this website are those of the author and not necessarily shared by The Electoral Commission. |
Nicholas Whyte, 3 June 1998; last updated 13 December 2019 by Conal Kelly.
|
Disclaimer:� Nicholas Whyte 1998-2015
|