

| |
|
|
|
|
|
|
 |
| Map and graph by Conal Kelly | |
2019 Westminster notional result on new boundaries:
| DUP | UUP | Alliance | Ind | SDLP | SF | Aontu | ||
| 2019 actual | 21,929 | 2,650 | 751 | 3,446 | 21,986 | |||
| 0.0% | 43.2% | 5.2% | 1.5% | 6.8% | 43.3% | 0.0% | ||
| From Fermanagh and South Tyrone |
To Fermanagh and South Tyrone | 22,722 | 2,761 | 751 | 3,608 | 23,017 | ||
| From Fermanagh and South Tyrone | To Mid Ulster |
-793 | -111 | -162 | -1031 | |||
| From Newry and Armagh |
To Fermanagh and South Tyrone | 760 | 290 | 201 | 353 | 757 | 61 | |
| From Mid Ulster | To Fermanagh and South Tyrone | 136 | 32 | 44 | 79 | 255 | ||
| 2019 notional | 896 | 21,458 | 2,784 | 751 | 3,717 | 21,968 | 61 | |
| 1.7% | 41.6% | 5.4% | 1.5% | 7.2% | 42.5% | 0.1% | ||
| 1.7% | -1.6% | 0.2% | 0.0% | 0.4% | -0.8% | 0.1% |
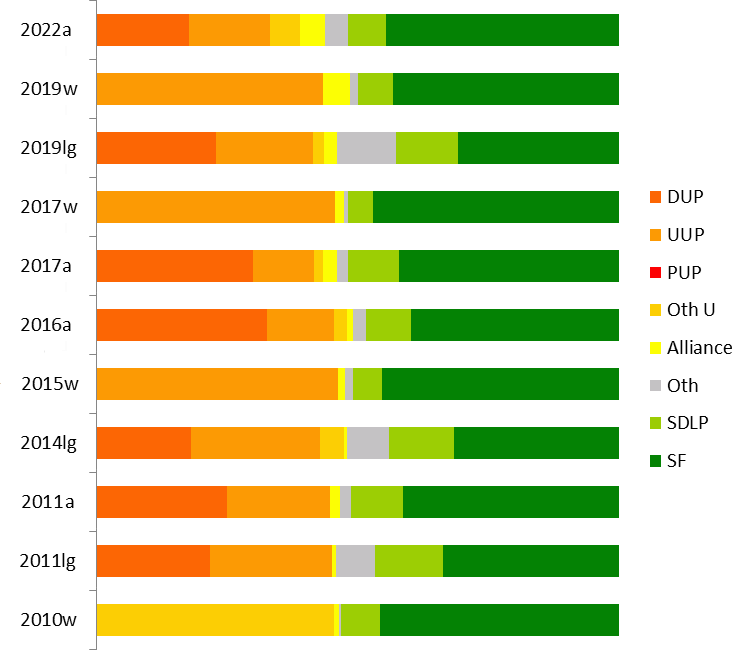
| DUP | UUP | Oth U | Alliance | Oth | SDLP | SF | |
| 2024w |
39.7% |
|
4.7% |
2.2% |
4.7% |
48.6% |
|
| 2022a |
17.7% | 15.5% | 5.8% | 4.8% | 4.4% | 7.1% | 44.7% |
| 2019w | 43.2% | 5.2% | 1.5% | 6.8% | 43.3% | ||
| 2019lg |
22.8% | 18.6% | 2.1% | 2.5% | 11.6% | 11.9% | 30.8% |
| 2017w | 45.5% | 1.7% | 0.8% | 4.8% | 47.2% | ||
| 2017a |
29.8% | 11.6% | 1.6% | 2.7% | 2.3% | 9.8% | 42.1% |
| 2016a |
32.6% | 12.8% | 2.5% | 1.1% | 2.5% | 8.5% | 39.9% |
| 2015w |
46.4% | 1.3% | 1.5% | 5.4% | 45.4% | ||
| 2014lg |
18.1% | 24.4% | 4.6% | 0.6% | 8.1% | 12.4% | 31.8% |
| 2011a |
24.4% | 19.3% | 2.6% | 1.8% | 2.1% | 9.6% | 40.3% |
| 2011lg |
21.4% | 23.1% | 1.5% | 0.7% | 7.5% | 12.7% | 33.1% |
| 2010w | 45.5% | 0.9% | 0.4% | 7.6% | 45.5% | ||
| 2007a |
25.5% | 19.7% | 0.8% | 1.1% | 2.7% | 14.0% | 36.2% |
| 2005w | 28.8% | 18.2% | 14.8% | 38.2% | |||
| 2005lg | 25.0% | 21.7% | 1.2% | 17.2% | 34.9% |
NB that the figures for elections before 2010 are projections.
| @Jemma Dolan (SF)
9,067 (16.9%) @Colm Gildernew (SF) 7,562 (14.1%) @Aine Murphy (SF) 7,379 (13.7%) Tom Elliott (UUP) 5,442 (10.1%) @Deborah Erskine (DUP) 5,272 (9.8%) Paul Bell (DUP) 4,255 (7.9%) Adam Gannon (SDLP) 3,836 (7.1%) Alex Elliott (TUV) 3,091 (5.8%) @Rosemary Barton (UUP) 2,912 (5.4%) Matthew Beaumont (Alliance) 2,583 (4.8%) Denise Mullen (Aontú) 927 (1.7%) Donal O'Cofaigh (CCLA) 602 (1.1%) Kellie Turtle (Green) 335 (0.6%) Emma DeSouza (Ind) 249 (0.5%) Derek Backhouse (Ind) 128 (0.2%) Emmett Kilpatrick (PBP) 103 (0.2%) @ member of the Assembly when it was dissolved. |
SF 24,008 (44.7%, +2.6%)
3 seats DUP 9,527 (17.7%, -12.1%) 1 seat UUP 8,354 (15.5%, +3.9%) 1 seat SDLP 3,836 (7.1%, -2.7%) TUV 3,091 (5.8%, +4.3%) Alliance 2,583 (4.8%, +2.1%) Aontú 927 (1.7%) CCLA 602 (1.1%, -0.1%) Ind 377 (0.7%) Green 335 (0.6%, -0.5%) PBP 103 (0.2%) Electorate: 78,963 Votes cast: 54,560 (69.1%, -3.5%), spoilt votes 817 (1.5%) Valid votes: 53,743, quota 8,958 |
*Michelle Gildernew (SF) 21,986 (43.3%, -3.9%)
Tom Elliott (UUP) 21,929 (43.2%, -2.3%)
Adam Gannon (SDLP) 3,446 (6.8%, +2.0%)
Matthew Beaumont (Alliance) 2,650 (5.2%, +3.6%)
Caroline Wheeler (Ind) 751 (1.5%, +1.5%)
* outgoing MP.
Electorate: 72,848; Total Poll: 51,087 (70.1%); Invalid Votes:
325 (0.6%); Valid Votes: 50,762
In another photo-finish, Gildernew was returned once more. A
massive two-party squeeze normally means those in the middle
losing votes, but here the opposite applied, with the SDLP gaining
from SF and Alliance gaining from both SF and the UUP. In the end
the squeeze was not quite enough for the UUP to regain the seat,
their best shot of the day, and SF held it by a mere 57 votes. In
a five-seat Assembly election, these votes would give SF and the
UUP two seats each, with the last seat likely going to the SDLP.
From the 2011 census, Fermanagh and South Tyrone includes:
The entire Fermanagh and Omagh DEA of Enniskillen
@Michelle Gildernew (SF) 25,230 (47.2%, +1.8%)
*Tom Elliott (UUP) 24,355 (45.5%, -0.9%)
Mary Garrity (SDLP) 2,587 (4.8%, -0.6%)
Noreen Campbell (Alliance) 886 (1.7%, +0.4%)
Tanya Jones (Green) 423 (0.8%, -1.7%)
| @Arlene Foster (DUP)
8,479 (16.2%) @Michelle Gildernew (SF) 7,987 (15.3%) Jemma Dolan (SF) 7,767 (14.9%) @[Lord] Maurice Morrow (DUP) 7,102 (13.6%) @Seán Lynch (SF) 6,254 (12.0%) @Rosemary Barton (UUP) 6,060 (11.6%) @Richie McPhillips (SDLP) 5,134 (9.8%) Noreen Campbell (Alliance) 1,437 (2.7%) Alex Elliott (TUV) 780 (1.5%) Donal O'Cofaigh (Cross Comm Lab Alt) 643 (1.2%) Tanya Jones (Green) 550 (1.1%) Richard Dunn (Con) 70 (0.1%) @ member of the Assembly when it was dissolved. |
SF 22,008 (42.1%, +2.2%)
3 seats (+1) DUP 15,581 (29.8%, -2.8%) 1 seat (-1) UUP 6,060 (11.6%, -1.2%) 1 seat SDLP 5,134 (9.8%, +1.4%) 0 seats (-1) Alliance 1,437 (2.7%, 1.6%) TUV 780 (1.5%, -1.0%) Cross Comm Lab Alt 643 (1.2%) Green 550 (1.1%, -0.8%) Con 70 (0.1%) Electorate: 73,100 Votes cast: 53,075 (72.6%, +8.0%), spoilt votes 812 (1.5%) Valid votes: 52,263, quota 8,711 |
| @Arlene Foster (DUP) 8,801 (18.7%) @[Lord] Maurice Morrow (DUP) 6,602 (14.1%) Michelle Gildernew (Sinn Féin) 6,614 (14.0%) @Seán Lynch (Sinn Féin) 4,782 (10.1%) Richie McPhillips (SDLP) 4,014 (8.5%) John Feely (Sinn Féin) 4,002 (8.5%) Rosemary Barton (UUP) 3,018 (6.4%) @Alastair Patterson (UUP) 3,010 (6.4%) @Phil Flanagan (Sinn Féin) 3,449 (7.3%) Donald Crawford (TUV) 1,164 (2.5%) Tanya Jones (Green (NI)) 897 (1.9%) Kerri Blyberg (Alliance) 539 (1.1%) Damien Harris (NI Labour) 285 (0.6%) @ member of the Assembly when it was dissolved. |
Sinn Féin18,847 (39.9%,
-0.4%) 2 seats (-1) DUP 15,403 (32.6%, +8.2%) 2 seats UUP 6,028 (12.8%, -6.5%) 1 seat SDLP 4,014 (8.5%, -1.1%) 1 seat (+1) TUV 1,164 (2.5%, -0.1%) Green 897 (1.9%) Alliance 539 (1.1%, -0.7%) NI Labour 285 (0.6%) Electorate: 74,257 Turnout: 47,934 (64.6%); spoilt votes 757 (1.6%) Valid votes: 47,177; quota: 6,740 |
Tom Elliott (UUP) 23,608 (46.4%)
*Michelle Gildernew (SF) 23,078 (45.4%, -0.1%)
John Coyle (SDLP) 2,732 (5.4%, -2.3%)
Tanya Jones (Green) 788 (1.5%)
Hannah Su (Alliance) 658 (1.3%, +0.4%)
Electorate: 70,108; Total Poll: 51,152 (73.0%); Invalid Votes: 286
(0.6%); Valid Votes: 50,864
A dramatic victory for the UUP, adding to their recapture of
South Antrim - the first time that a Nationalist-held seat has
been captured by Unionists since 1983. I confess that I did not
see it coming.
If cast in a six-seat Assembly election, these votes would give
the UUP and SF three seats each.
From the 2011 census, Fermanagh and South Tyrone includes:
The entire Fermanagh and Omagh DEA of Enniskillen
| @Michelle Gildernew MP (SF) 9,110 (19 .0%) @Tom Elliott (UUP) 6,896 (14.4%) @Arlene Foster (DUP) 6,876 (14.3%) Sean Lynch (SF) 5,146 (10.7%) Phil Flanagan (SF) 5,082 (10.6%) @[Lord] Maurice Morrow (DUP) 4,844 (10.1%) @Tommy Gallagher (SDLP) 4,606 (9.6%) Kenny Donaldson (UUP) 2,366 (4.9%) Alex Elliott (TUV) 1,231 (2.6%) Pat Cox (Independent) 997 (2.1%) Hannah Su (Alliance) 845 (1.8%) @ member of the Assembly when it was dissolved. |
SF 19,338 (40.3%, +4.0%) 3 seats (+1) DUP 11,720 (24.4%, -1.1%) 2 seats UUP 9,262 (19.3%, -0.4%) 1 seat SDLP 4,606 (9.6%, -4.4%) (-1) TUV 1,231 (2.6%) Cox 997 (2.1%) Alliance 845 (1.8%, +0.6%) Electorate: 70,985 Turnout: 48,949 (69.0%); spoilt votes 950 (1.9%) Valid votes: 47,999; quota: 6,858 |
An impressive result for SF, who
managed to largely contnue their squeeze on the SDLP from the
previous year and took the SDLP seat here, Phil Flanagan a crucial
62 votes ahead of Tommy Gallagher on the last count (with the
constituency providing the closest result of the 18 for the second
time in a row).
*@Michelle Gildernew (Sinn Féin) 21,304
(45.5%, +7.3%)
Rodney Connor (Independent) 21,300 (45.5%)
Fearghal McKinney (SDLP) 3,574 (7.6%, -7.2%)
Vasundhara Kamble (Alliance) 437 (0.9%)
John Stevenson (Independent) 188 (0.4%)
Electorate: 67,908; Total poll: 47,066 (69.3%); Invalid Votes: 263
(0.6%); Valid Votes: 46,803
* incumbent
@ elected to the Northern Ireland Assembly from this constituency
An extraordinary result, the closest in the UK, with Gildernew retaining her seat by a mere four votes (the next smallest majority was Glenda Jackson's victory in Hampstead and Kilburn, by 42 over the Conservatives). Gildernew effectively squeezed the SDLP vote by almost half, and it would appear that Connor was not able to move quite enough supporters of the two main Unionist parties to come out on the day. If these votes were cast in an Assembly election, Connor's supporters would win three seats, and so would Sinn F�in.
| *Arlene Foster (DUP) 7138 (15.4%) *Michelle Gildernew MP (SF) 7026 (15.1%) *Tom Elliott (UUP) 6603 (14.2%) *Gerry McHugh (SF) 5103 (11.0%) Sean Lynch (SF) 4704 (10.1%) *Maurice [Lord] Morrow (DUP) 4700 (10.1%) *Tommy Gallagher (SDLP) 4440 (9.6%) Kenneth Donaldson (UUP) 2531 (5.4%) Vincent Currie (SDLP) 2043 (4.4%) Gerry McGeough (Independent) 814 (1.8%) Allan Leonard (Alliance) 521 (1.1%) Michael McManus (Independent) 431 (0.9%) ^Robert McCartney (UKUP) 388 (0.8%) *Elected in 2003 from Fermanagh-South Tyrone ^Elected in 2003 from North Down |
SF 16,833 (36.2%, +1.8%) 2
seats DUP 11,838 (25.5%, +4.6%) 2 seats (+1) UUP 9,134 (19.7%, -9.0%) 1 seat (-1) SDLP 6,483 (14.0%, -2.3%) 1 seat Inds 1,245 (2.7%) Alliance 521 (1.1%, +0.6%) UKUP 388 (0.8%) Electorate 65,826 Votes cast 46,845 (71.1%); spoilt votes 403 (0.9%) Valid votes 46,442; quota 6,636 |
*@Michelle Gildernew (Sinn Fein) 18,638 (38.2% +4.1%)
@Arlene Foster (DUP) 14,056 (28.8%)
@Tom Elliot (UUP) 8,869 (18.2% -15.8%)
@Tommy Gallagher (SDLP) 7,230 (14.8% -3.9%)
* outgoing MP.
@ Member of the Assembly
Given the continuing split between the Unionist candidates, Sinn Fein were always likely to hold this seat. These votes, if cast in a six-seat STV election, would give Sinn Fein and the DUP two seats each, and the UUP and SDLP one each.
The constituency comprises all 23 wards in Fermanagh and 16 of 22 wards in Dungannon (all 5 wards in the Blackwater DEA, all 5 wards in the Clogher Valley DEA, and all 6 wards in the Dungannon Town DEA. First preference votes cast were as follows:
Sinn Fein 16954 (34.9%)
DUP 12162 (25.0%)
UUP 10534 (21.7%)
SDLP 8336 (17.2%)
Socialist Party 406 (0.8%)
Green 79 (0.2%)
Independent 115 (0.2%)
If cast in a six-seat STV election, these votes would elect two each from SF and the DUP, and one each from the UUP and the SDLP.
| *Michelle
Gildernew (SF) 6489 (14.1%) Tom Elliott (UUP) 6181 (13.4%) *Maurice Morrow (DUP) 5536 (12.0%) Tom O'Reilly (SF) 5019 (10.9%) Arlene Foster (UUP) 4938 (10.7%) *Tommy Gallagher (SDLP) 4735 (10.3%) *Gerry McHugh (SF) 4393 (9.5%) Bert Johnston (DUP) 3094 (6.7%) Frank Britton (SDLP) 2772 (6.0%) Robert Mulligan (UUP) 2110 (4.6%) Eithne McNulty (NIWC) 650 (1.4%) Linda Cleland (Alliance) 243 (0.5%) |
SF 15,901 (34.4%, +7.5%) UUP 13,229 (28.7%, +4.1%) DUP 8,630 (18.7%, +4.8%) SDLP 7,507 (16.3%, -5.3%) NIWC 650 (1.4%, -2.0%) Alliance 243 (0.5%, -0.7%) Electorate 64,336 |
Subsequent developments: Foster resigned from the UUP on 18 December 2003 and later joined the DUP. Morrow was elevated to the House of Lords as Baron Morrow of Clogher Valley in June 2006
Fermanagh-South Tyrone had lost 7.95% of its electorate in the great electoral register shake-out, less than any constituency except Mid Ulster, varying from 13.11% in the Drumglass ward of Dungannon to 2.31% in the Tempo ward of Fermanagh. Electorate: 66,640; votes cast: 52,667 (79.0%); spoilt votes:
693 (1.3%)
Valid votes: 51,974; SF majority 53
@ member of the Assembly
One of SF's two dramatic gains in the election, though the margin was so narrow that the defeated UUP were threatening a court case. A six-seat Assembly election, based on these votes, would give SF and the UUP two seats each, and one each to the SDLP and Dixon.
SF 16193 (31%)
UUP 15385 (30%)
SDLP 9560 (18%)
DUP 8502 (16%)
UKUP 182 (0.4%)
Independents 1969 (4%)
Total valid votes 51791
These votes would have given the UUP and SF two seats each, and the SDLP and DUP one each.
| *Tommy Gallagher (SDLP) 8,135
*Sam Foster (UUP) 5,589 *Gerry McHugh (SF) 5,459 Michelle Gildernew (SF) 4,703 Joan Carson (UUP) 4,400 Jim Dixon (UKU) 4,262 *Maurice Morrow (DUP) 3,987 Pat Treanor (SF) 3,552 Bert Johnston (DUP) 3,095 Olive Mullen (SDLP) 2,872 Bertie Kerr (UUP) 2,583 Marie Crawley (NIWC) 1,729 Stephen Farry (All) 614 Simeon Gillan (NLP) 63 |
SF 13,714 votes (26.87%) 2
seats UUP 12,572 votes (24.63%) 2 seats SDLP 11,007 votes (21.56%) 1 seat DUP 7,082 votes (13.87%) 1 seat UKUP 4,262 votes (8.35%) WC 1,729 votes (3.39%) Alliance 614 votes (1.2%) NLP 63 votes (0.12%) Electorate 65,383 |
* elected in 1996 Forum/talks election from Fermanagh-South Tyrone
No big surprise here as Sinn Féin consolidated their lead over the SDLP for the Nationalist vote. The UKUP started in sixth place, but were overtaken by the DUP's Maurice Morrow when his running-mate was eliminated. The UUP's Joan Carson took the last seat with 6,582 votes to Jim Dixon's 5,001, and Foster's undistributed surplus of 203 would have widened the gap. Dixon was to wreak revenge in 2001.
First preference votes cast in the whole of the Fermanagh council area and three Dungannon electoral areas were as follows:
Ulster Unionist Party 17,875 votes (39%)
Sinn Fein 10,413 votes (23%)
Social Democratic and Labour Party 8,329 votes (18%)
Democratic Unionist Party 5,563 votes (12%)
Non Party 1250 votes (3%)
Independent Nationalist 909 votes (2%)
Progressive Socialist 581 votes (1%)
Alliance Party of Northern Ireland 523 votes (1%)
Democratic Left 412 votes (1%)
Women's Coalition 319 votes (1%)
Total valid votes 46,174 (71.24% of electorate)
Ulster Unionist Party (UUP) 15,542 (32%) Ken Maginnis, Sam
Foster elected
Sinn Féin (SF) 11,666 (24%); Gerry McHugh elected
Social Democratic and Labour Party (SDLP) 10,399 (22%); Tommy
Gallagher elected
Democratic Unionist Party (DUP) 6,589 (14%); Maurice Morrow
elected
Alliance Party of Northern Ireland (APNI) 831 (2%)
United Kingdom Unionist Party (UKUP) 468 (1%)
Ulster Democratic Party (UDP) 464 (1%)
Northern Ireland Women's Coalition (NIWC) 461 (1%)
Progressive Unionist Party (PUP) 410 (1%)
Labour (Lab) 297 (1%)
Green Party 208 (0.43%)
Workers Party (WP) 199 (0.41%)
Ulster Independence Movement (UIM) 189 (0.39%)
Democratic Left (DL) 128 (0.27%)
Independent McMullan 118 (0.25%)
Conservative Party (Con) 113 (0.23%)
Independent Chambers 36 (0.07%)
Natural Law Party (NLP) 23 (0.05%)
Electorate: 63,716; votes cast: 48,355 (75.8%); spoilt votes: 214 (0.4%); valid votes: 48,141
Maginnis had been elected to the 1982 Assembly for Fermanagh and South Tyrone.
| DUP | UUP | Oth U | Alliance | Oth | SDLP | SF | |
| 2007a |
26% | 20% | 1% | 1% | 3% | 14% | 36% |
| 2005w | 29% | 18% | 15% | 38% | |||
| 2005lg | 25% | 22% | 1% | 17% | 35% | ||
| 2003a | 19% | 29% | 1% | 1% | 16% | 34% | |
| 2001w | 34% | 13% | 19% | 34% | |||
| 2001lg | 16% | 30% | 0% | 4% | 18% | 31% | |
| 1998a | 14% | 25% | 8% | 1% | 4% | 22% | 27% |
| 1997lg | 12% | 39% | 1% | 8% | 18% | 23% | |
| 1997w | 51% | 2% | 0% | 23% | 23% | ||
| 1996f | 14% | 32% | 3% | 2% | 3% | 22% | 24% |
See also: Full 2003 results from Fermanagh and South Tyrone | Full 1998 results from Fermanagh and South Tyrone | The Boundary Commission's Provisional Recommendations | Boundary Commission 2003 | Jim Riley's analysis of votes and seats in the 1998 Assembly election | The constituencies
Other sites based at ARK: ORB (Online Research Bank) | CAIN (Conflict Archive on the INternet) | Northern Ireland Life and Times Survey
Your comments, please! Send an email to me at nicholas.whyte@gmail.com.
 |
This page has been developed with the support of a project grant from the New Initiatives Fund of the Electoral Commission. However, any views expressed on this page or, in particular, other pages of this website are those of the author and not necessarily shared by The Electoral Commission. |
Nicholas Whyte, 3 June 1998; last updated 7 May 2022 by Conal Kelly.
|
Disclaimer:� Nicholas Whyte 1998-2007
|