

| |
|
|
|
|
|
|
 |
| Map and graph by Conal Kelly | |
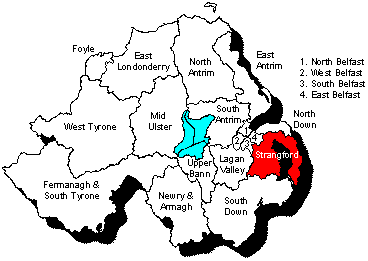
This constituency takes in the southern half of North Down and Ards District Council, the
Saintfield area of Newry, Mourne and Down
District Council. and a corner of Lisburn
and Castlereagh District Council. The member of parliament
has been Jim Shannon of the DUP since 2010, replacing his fellow
DUP member Iris Robinson who had held it since 2001; John Taylor
(UUP deputy leader) had represented Strangford since it was formed
in 1983, but chose to stand down in 2001 (and got a life peerage,
becoming Lord Kilclooney). The DUP and Alliance each hold two
Assembly seats here, the other is held by the UUP. See the 1983-92 Strangford results.
2019 Westminster notional result on new boundaries:
| DUP | UUP | UKIP | Cons | APNI | Gr | SDLP | SF | Aontu | ||
| 2019 actual |
17,705 | 4,023 | 308 | 1,476 | 10,634 | 790 | 1,994 | 555 | ||
| 47.2% | 10.7% | 0.8% | 3.9% | 28.4% | 2.1% | 5.3% | 1.5% | 0.0% | ||
| From Strangford |
To Strangford |
16,068 | 3,651 | 308 | 1,340 | 9,651 | 717 | 1,787 | 555 | |
| From Strangford | To South Belfast and Mid Down |
-1634 | -372 | -136 | -981 | -73 | -207 | |||
| From Strangford | To North Down |
-3 | -1 | -2 | ||||||
| From Strangford | To South Down |
-1 | ||||||||
| From South Down |
To Strangford |
60 | 26 | 800 | 2,215 | 2,462 | 193 | |||
| 2019 notional |
16,128 | 3,677 | 308 | 1,340 | 10,451 | 717 | 4,002 | 3,017 | 193 | |
| 40.5% | 9.2% | 0.8% | 3.4% | 26.2% | 1.8% | 10.0% | 7.6% | 0.5% | ||
| -6.7% | -1.5% | 0.0% | -0.6% | -2.1% | -0.3% | +4.7% | +6.1% | +0.5% |
| |
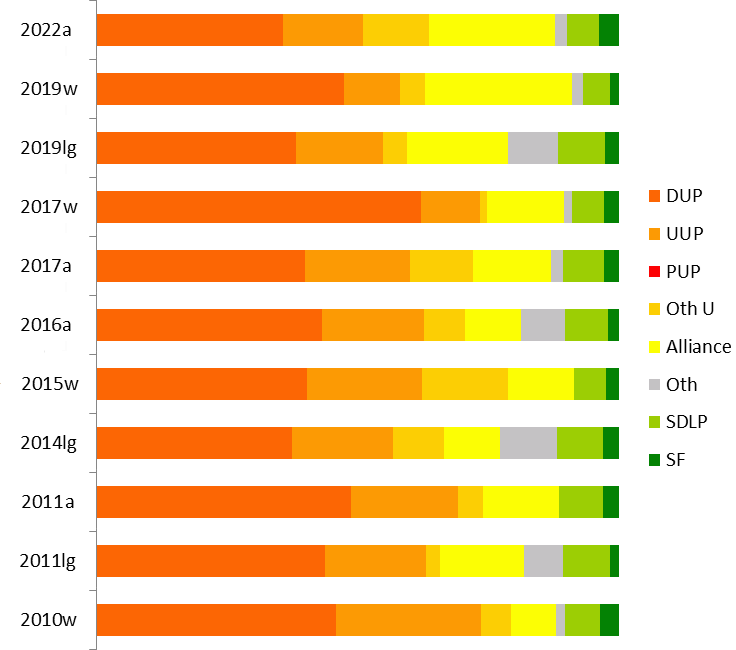
DUP | UUP | Oth U | Alliance | Oth | SDLP | SF |
| 2024w | 40.0% |
10.1% |
8.5% |
26.8% |
2.9% |
4.6% |
7.2% |
| 2022a | 35.8% | 15.2% | 12.7% | 24.1% | 2.3% | 6.0% | 3.9% |
| 2019w | 47.2% | 10.7% | 4.8% | 28.4% | 2.1% | 5.3% | 1.5% |
| 2019lg | 36.8% | 16.1% | 4.3% | 18.6% | 9.1% | 8.7% | 2.4% |
| 2017w | 62.0% | 11.4% | 1.3% | 14.7% | 1.6% | 6.2% | 2.8% |
| 2017a | 39.9% | 20.0% | 11.9% | 15.0% | 2.4% | 7.9% | 2.9% |
| 2016a | 43.0% | 19.5% | 7.6% | 10.7% | 8.8% | 8.3% | 2.0% |
| 2015w | 44.4% | 24.3% | 18.0% | 13.8% | 6.9% | 2.6% | |
| 2014lg | 37.5% | 19.3% | 9.9% | 10.7% | 10.9% | 8.8% | 3.0% |
| 2011a |
48.8% | 20.4% | 4.8% | 14.4% | 8.5% | 3.0% | |
| 2011lg | 43.8% | 19.4% | 2.7% | 16.0% | 7.4% | 9.1% | 1.6% |
| 2010w | 45.9% | 27.8% | 5.6% | 8.7% | 1.7% | 6.7% | 3.6% |
| 2007a |
48.9% | 18.5% | 6.0% | 10.1% | 2.9% | 9.2% | 4.3% |
| 2005w | 54.8% | 21.4% | 3.5% | 8.4% | 8.2% | 3.7% | |
| 2005lg | 48.0% | 26.0% | 1.9% | 11.7% | 1.7% | 8.0% | 2.7% |
NB that the figures for elections before 2010 are projections.
Figures for the previous boundaries can be found at the bottom of
this page.
NB also that the Conservatives supported the UUP candidate in
2010, but account for all the "Other Unionist" vote in the 2005
Westminster election and a quarter of the "Other Unionist" vote in
2007.
| @Kellie Armstrong
(Alliance) 7,015 (17.2%) @Michelle McIlveen (DUP) 6,601 (16.2%) Stephen Cooper (TUV) 5,186 (12.7%) @Harry Harvey (DUP) 4,704 (11.5%) @Mike Nesbitt (UUP) 3,693 (9.0%) @Peter Weir (DUP) 3,313 (8.1%) Nick Mathison (Alliance) 2,822 (6.9%) Philip Smith (UUP) 2,535 (6.2%) Conor Houston (SDLP) 2,440 (6.0%) Roisin McGivern (SF) 1,607 (3.9%) Maurice Macartney (Green) 831 (2.0%) Ben King (Ind) 118 (0.3%) @ member of the Assembly when it was dissolved. |
DUP 14,618 (35.8%,
-4.1%) 2 seats (-1) Alliance 9,837 (24.1%, +9.1%) 2 seats UUP 6,228 (15.2%, -4.8%) 1 seat TUV 5,186 (12.7%, +9.3%) SDLP 2,440 (6.0%, -1.9%) SF 1,607 (3.9%, +1.0%) Green 831 (2.0%, -0.4%) Ind 118 (0.3%) Electorate: 70,775 Votes cast: 41,345 (58.4%, -2.5%), spoilt votes 480 (1.2%) Valid votes: 40,865, quota 6,811 |
A strong performance by Alliance saw
them pick up a second seat in Strangford at the expense of the
DUP. In the second closest result of the election, Alliance's
Mathison won the last seat by 249.77 votes ahead of the TUV's
Stephen Cooper, with no surplus votes undistributed. Mathison
having started in 7th place overtook 3rd placed Cooper thanks to
SDLP transfers on the final count. This was the TUV's best chance
of a gain, but they were simply too transfer-repellent. Mathison
had the fewest first preference votes of any elected MLA.
Alliance's Kellie Armstrong was the first MLA returned in the
election. Strangford had the lowest turnout of the election at
58.4%.
*Jim Shannon (DUP) 17,705 (47.2%, -14.8%)
@Kellie Armstrong (Alliance) 10,634 (28.4%, +13.7%)
Philip Smith (UUP) 4,023 (10.7%, -0.7%)
Joe Boyle (SDLP) 1,994 (5.3%, -0.9%)
Grant Abraham (Cons) 1,476 (3.9%, +2.6%)
Martin Macartney (Green) 790 (2.1%, +0.5%)
Ryan Carlin (SF) 555 (1.5%, -1.3%)
Robert Stephenson (UKIP) 308 (0.8%, +0.8%)
* outgoing MP.
@ member of the Assembly.
Electorate: 66,928; Total Poll: 37,669 (56.3%); Invalid Votes:
184 (0.5%); Valid Votes: 37,485
A comfortable win for the incumbent. On the face of it, a
straight shift of 5,000 votes from the DUP to Alliance (and 1,000
to the Conservatives). This was the Green Party's best performance
of the election. In a five-seat Assembly election, these votes
would give the DUP three seats and Alliance two.
From the 2011 census, Strangford includes:
The entire North Down and Ards DEA of Comber *Jim Shannon (DUP) 24,036 (62.0%, +17.6%)
@Kellie Armstrong (Alliance) 5,693 (14.7%, +0.9%)
@Mike Nesbitt (UUP) 4,419 (11.4%, -2.9%)
Joe Boyle (SDLP) 2,404 (6.2%, -0.7%)
Carole Murphy (SF) 1,083 (2.8%, +0.2%)
Ricky Bamford (Green) 607 (1.6%)
Claire Hiscott (Con) 507 (1.3%, -6.4%)
* outgoing MP.
@ member of the Assembly.
Electorate: 64,327; Total Poll: 38,826 (60.4%); Invalid Votes:
77 (0.2%); Valid Votes: 38,826
Another good result for the DUP. If cast in a five-seat Assembly
election, these votes would elect four DUP MLAs and one Alliance
(with an option for the UUP if the DUP balanced very poorly).
| @Simon Hamilton (DUP)
6,221 (16.0%) @Kellie Armstrong (Alliance) 5,813 (15.0%) @Michelle McIlveen (DUP) 5,728 (14.8%) @Mike Nesbitt (UUP) 5,323 (13.7%) Peter Weir (DUP) 3,543 (9.1%) Joe Boyle (SDLP) 3,045 (7.9%) @Philip Smith (UUP) 2,453 (6.3%) Jimmy Menagh (Ind) 1,627 (4.2%) @Jonathan Bell (Ind) 1,479 (3.8%) Stephen Cooper (TUV) 1,330 (3.4%) Dermot Kennedy (SF) 1,110 (2.9%) Ricky Bamford (Green) 918 (2.4%) Scott Benton (Con) 195 (0.5%) @ member of the Assembly when it was dissolved. |
DUP 15,492 (39.9%,
-3.1%) 3 seats UUP 7,776 (20.0%, +0.5%) 1 seat (-1) Alliance 5,813 (15.0%, +4.3%) 1 seat Ind 3,106 (8.0%) SDLP 3,045 (7.9%, -0.4%) TUV 1,330 (3.4%, -0.9%) SF 1,110 (2.9%, +0.9%) Green 918 (2.4%, -0.4%) Con 195 (0.5%, -0.5%) Electorate: 64,393 Votes cast: 39,239 (60.9%, +10.6%), spoilt votes 454 (1.2%) Valid votes: 38,785, quota 6,465 |
The SDLP have been runners-up at every
Assembly election here since the Good Friday Agreement, and came
closer this time than they had since 2007, Joe Boyle finishing
only 225.29 behind the DUP's Peter Weir. The UUP had been very
lucky to win two seats in 2016, and were not as lucky this time.
Still, better balancing could have kept both of their candidates
ahead of Weir.
| @Mike Nesbitt (UUP) 4,673
(14.3%) @Michelle McIlveen (DUP) 4,663 (14.3%) @Simon Hamilton (DUP) 3,964 (12.1%) Kellie Armstrong (Alliance) 3,499 (10.7%) @Jonathan Bell (DUP) 3,393 (10.4%) Joe Boyle (SDLP) 2,724 (8.3%) Harry Harvey (DUP) 2,017 (6.2%) Jimmy Menagh (Independent) 1,840 (5.6%) Philip Smith (UUP) 1,694 (5.2%) Stephen Cooper (TUV) 1,407 (4.3%) Georgia Grainger (Green) 924 (2.8%) Stephen Crosby (UKIP) 759 (2.3%) Dermot Kennedy (Sinn Féin) 661 (2.0%) Bill McKendry (Conservatives) 314 (1.0%) Rab McCartney (Independent) 107 (0.3%)) @ member of the Assembly when it was dissolved. |
DUP 14,037 (43.0%, -5.8%)
3 seats UUP 6,367 (19.5%, -0.9%) 2 seats Alliance 3,499 (10.7%, -3.7%) 1 seat SDLP 2,724 (8.3%, -0.2%) Independents 1,947 (6.0%) TUV 1,407 (4.3%, +1.5%) Green 924 (2.8%) UKIP 759 (2.3%, +0.3%) Sinn Féin 661 (2.0%, -1.0%) Conservatives 314 (1.0%) Electorate 65,695 Votes cast 33,014 (50.3%); spoilt 375 (1.1%) Valid votes: 32,639; quota: 4,663 |
No change in party strength, though
with the UUP's Philip Smith squeaking in from ninth place in first
preferences to finally beat Joe Boyle of the SDLP by 569.96 votes.
The real deciding moment was a much earlier count when Smith,
independent Jimmy Menagh and the DUP's Harry Harvey were clustered
within 110 votes of each other, on 2335, 2249 and 2226
respectively. Harvey was eliminated, and DUP transfers pulled
Smith well ahead of Menagh, whose transfers he then got.
*Jim Shannon (DUP) 15,053 (44.4%, -1.5%)
Robert Burgess (UUP) 4,868 (14.3%, -13.5%)
Kellie Armstrong (Alliance) 4,687 (13.8%, +5.1%)
Joe Boyle (SDLP) 2,335 (6.9%, +0.2%)
Joe Jordan (UKIP) 2,237 (6.6%)
Johnny Andrews (Conservative) 2,167 (6.4%)
Stephen Cooper (TUV) 1,701 (5.0%, -0.6%)
Sheila Bailie (SF) 876 (2.6%, -1.0%)
Electorate: 64,289; Total Poll: 34,110 (53.1%); Invalid Votes: 180
(0.5%); Valid Votes: 33,924
A solid defence by Shannon, his majority improved by the slump in
the UUP vote which appears to have gone roughly equally to
Alliance, UKIP and the Conservatives.
If cast in a six-seat Assembly election, these votes would have given the DUP three seats and the UUP and Alliance one each. The sixth is difficult to assess but my gut is that the SDLP would get no transfers and UKIP would pick up the sweepings.
From the 2011 census, Strangford includes:
The entire North Down and Ards DEA of Comber| Michelle McIlveen (DUP) 4,573 (15.4%) Kieran McCarthy (Alliance) 4,284 (14.4%) Jonathan Bell (DUP) 4,265 (14.4%) Simon Hamilton (DUP) 3,456 (11.6%) Mike Nesbitt (UUP) 3,273 (11.0%) David McNarry (UUP) 2,773 (9.3%) Joe Boyle (SDLP) 2,525 (8.5%) Billy Walker (DUP) 2,175 (7.3%) Mickey Coogan (SF) 902 (3.0%) Terry Williams (TUV) 841 (2.8%) Cecil Andrews (UKIP) 601 (2.0%) @ member of the Assembly when it was dissolved. |
DUP 14,469 (48.8%, -0.1%)
3 seats (-1) UUP 6,046 (20.4%, +1.5%) 2 seats (+1) Alliance 4,284 (14.4%, +4.3%) 1 seat SDLP 2,525 (8.5%, -0.7%) SF 902 (3.0%, -1.3%) TUV 841 (2.8%) UKIP 601 (2.0%) Electorate 62,178 Votes cast 30,186 (48.5%); spoilt 518 (1.7%) Valid votes: 29,668; quota: 4,239 |
The most surprising result of the election for me - I really thought that the SDLP, who missed the last seat here by 44 votes in 2007, and were favoured by boundary changes, would make the breakthrough; but in the end their vote filed to rise and they were beaten by 458 votes by the second UUP candidate, in a rare case of the UUP taking a seat from the DUP rather than the other way round.
@Jim Shannon (DUP) 14,926
(45.9%, -4.9%)
Mike Nesbitt (UCUNF) 9,050 (27.8%,+2.6%)*
Deborah Girvan (Alliance) 2,828 (8.7%, +0.3%)
Claire Hanna (SDLP) 2,164 (6.7%, -1.5%)
Terry Williams (TUV) 1,814 (5.6%)
Michael Coogan (Sinn Féin) 1,161 (3.6%, -0.1%)
Barbara Haig (Green) 562 (1.7%)
Electorate: 60,539; Total Poll: 32,600 (53.8%); Invalid Votes: 95
(0.3%); Valid Votes: 32,505
@ elected to the Northern Ireland
Assembly from this constituency
* vote change calculated from 2005 UUP and Conservative combined
total
There had been much speculation about the safety of the DUP's Westminster seat, given the spectacular implosion of former MP Iris Robinson's career and the presence of celebrity UCUNF candidate Mike Nesbitt in the race. In the event, though, Nesbitt got only a modest increase in his party's vote share (admittedly, in an election where they generally made no headway at all) and few DUP votes were eroded to the TUV, enabling Shannon to retain the seat for the party. If these votes were cast in a six-seat Assembly election, the DUP would probably lose one of their seats to the UUP; the Alliance seat would be under pressure from the SDLP (though I found it puzzling that the two Nationalist parties did not do better here, considering the impact of the new boundaries).
| *Iris Robinson MP (DUP)
5917 (16.4%) *Jim Shannon (DUP) 4788 (13.3%) *Kieran McCarthy (Alliance) 4085 (11.3%) Simon Hamilton (DUP) 3889 (10.8%) *David McNarry (UUP) 3709 (10.3%) Michelle McIlveen (DUP) 3468 (9.6%) Joe Boyle (SDLP) 3068 (8.5%) Angus Carson (UUP) 2128 (5.9%) Dermot Kennedy (SF) 1089 (3.0%) *George Ennis (UKUP) 872 (2.4%) Stephanie Sim (Green) 868 (2.4%) Michael Henderson (UUP) 675 (1.9%) Martin Gregg (Independent) 650 (1.8%) Robert Little (Conservative) 508 (1.4%) Cedric Wilson (Independent Unionist) 305 (0.8%) *Elected in 2003 from Strangford |
DUP 18,062 (50.1%, +2.2) 4
seats (+1) UUP 6,512 (18.1%, -10.9%) 1 seat (-1) Alliance 4,085 (11.3%, +4.0%) 1 seat SDLP 3,068 (8.5%, +0.7%) SF 1,089 (3.0%, +0.1%) UKUP 872 (2.4%) Green 868 (2.4%,+1.3%) Ind 650 (1.8%) Conservative 508 (1.4%) Ind U 305 (0.8%) Electorate 66,648 Votes cast 36,340 (54.5%); spoilt votes 321 (0.9%) Valid votes 36,019; quota 5,346 |
*@Iris Robinson (DUP) 20,921 (56.5% +13.7%)
Gareth McGimpsey (UUP) 7,872 (21.3% -19.0%)
@Kieran McCarthy (Alliance) 3,332 (9.0% +2.3%)
Joe Boyle (SDLP) 2,496 (6.7% +0.6%)
Terry Dick (Conservative) 1,462 (3.9%)
Dermot Kennedy (Sinn Fein) 949 (2.6% +0.4%)
* outgoing MP.
@ Member of the Assembly
In a six-seat STV election, these votes would give the DUP four seats and the UUP one, with the last seat between Alliance and the second UUP candidate (the SDLP would have an outside chance).
The constituency comprises 20 of the 23 wards in Ards (all 5 wards in the Ards Peninsula DEA, all 6 wards in the Ards West DEA, all 6 wards in the Newtownards DEA, and 3 of the 6 wards in the Ards East DEA [Gregstown, Loughries and Movilla]); 8 of the 23 wards in Castlereagh (5 of the 7 wards in the Castlereagh East DEA [Ballyhanwood, Carrowreagh, Dundonald, Enler and Graham's Bridge] and 3 of the 5 wards in the Castlereagh South DEA [Carryduff East, Carryduff West and Moneyreagh]); and 3 of the 23 wards in Down (3 of the 5 wards in the Rowallane DEA [Derryboy, Killyleagh and Saintfield]). Votes cast in 2005 were as follows:
DUP 17,776.7 (49.1%) - Best equivalent result for the DUP in
Northern Ireland
UUP 8,434.1 (23.3%)
Alliance 4,899.4 (13.5%)
SDLP 2,681.8 (7.4%)
Sinn Fein 716.8 (2.0%)
Green 203.2 (0.6%)
PUP 129.3 (0.4%)
Independents 1,333.6 (3.7%)
These votes, if cast in a six-seat STV election, would give the DUP three seats and Alliance and the UUP one each. The last seat would be slightly more likely to go to the UUP than the DUP.
| *Iris Robinson
(DUP) 8548 (22.9%) *Lord Kilclooney (UUP) 5658 (15.2%) *Jim Shannon (DUP) 4703 (12.6%) George Ennis (DUP) 4606 (12.4%) David McNarry (UUP) 3000 (8.1%) Joe Boyle (SDLP) 2906 (7.8%) *Kieran McCarthy (Alliance) 2741 (7.4%) Bob Little (UUP) 2123 (5.7%) Dermot Kennedy (SF) 1105 (3.0%) *Cedric Wilson (NIUP) 576 (1.5%) Colin Neill (PUP) 540 (1.4%) Philip Orr (Green) 425 (1.1%) Danny McCarthy (Ind) 319 (0.9%) |
DUP 17,857 (47.9%, +20.2%) 3
seats Best result for DUP in Northern Ireland
UUP 10,781 (28.9%, -0.3%) 2 seats SDLP 2,906 (7.8%, -1.2) Alliance 2,741 (7.4%, -4.8%) 1 seat SF 1,105 (3.0%, +1.6%) NIUP 576 (1.5%) PUP 540 (1.4%, -1.7%) Green 425 (1.1%, +0.6%) Ind 319 (0.9%) Electorate 66,308 |
Electorate: 72,192; votes cast: 43,471 (60.2%); spoilt votes: 217
(0.5%)
Valid votes: 43,254; DUP majority 1,110
@ member of the Assembly
This was the least unexpected of the DUP's gains; in fact the surprise was that Iris Robinson's majority was so low, presumably because of tactical voting by Alliance and SDLP supporters. In a six-seat Assembly election on these figures, the DUP would get three seats and the UUP two, with the last seat between the UUP and Alliance.
DUP 13753.5 (37%)
UUP 11324.5 (30%)
Alliance 5453 (15%)
SDLP 3024.8 (8%)
SF 420 (1%)
PUP 332.9 (1%)
Cons 221.2 (1%)
Independents 2875.7 (8%)
Total valid 37405.5
Extrapolating from the local government elections is very difficult because the Strangford constituency breaches no less than four local electoral area boundaries, and in addition there was no voting in one small part of the constituency. If we make some reasonable adjustments, we get these figures for the whole of Strangford. The DUP and UUP are both certain of two seats, and Alliance of one; the UUP would need transfers from the SDLP to beat the DUP for the last seat, which does not seem very likely.
| *Iris Robinson (DUP) 9,479 *John Taylor (UUP) 9,203 #Cedric Wilson (UKU) 3,078 *Kieran McCarthy (A) 2,947 Peter Osborne (A) 2,269 John Beattie (Ind UU) 2,247 Danny McCarthy (SDLP) 1,982 Brian Hanvey (SDLP) 1,883 *Thomas Benson (UUP) 1,623 *Jim Shannon (DUP) 1,415 Ricky Johnston (PUP) 1,342 David McNarry (UUP) 1,073 Tommy Jeffers (DUP) 1,007 Wilbert Magill (Unionist) 951 Tom Hamilton (UUP) 615 Paddy McGreevy (SF) 614 Blakely McNally (UDP) 322 Thomas Beattie (C) 263 Nancy Orr (Ind Community Cand) 201 Andrew Frew (Green) 200 Jonathan Stewart (Lab) 181 Sarah Mullins (NLP) 27 |
UUP 12,514 (29.16%) 2 seats
DUP 11,901 (27.73%) 2 seats Alliance 5,216 (12.15%) 1 seat SDLP 3,865 (9.00%) UKU 3,078 (7.17%) 1 seat Ind UU 2,247 (5.24%) PUP 1,342 (3.13%) Unionist 951 (2.22%) SF 614 (1.43%) UDP 322 (0.75%) C 263 (0.61%) Ind CC 201 (0.47%) Green 200 (0.47%) Lab 181 (0.42%) NLP 27 (0.06%) Electorate: 70,868 |
* elected in 1996 Forum/talks election from Strangford
# elected in 1996 Forum/talks election as a 'top-up' candidate.
Both DUP and UUP piled most of their first preferences onto their two lead candidates, but the transferred surplus votes pulled in later runners. This was always the second most likely seat for the UKUP to win. The SDLP polled very well in first preferences but attracted practically no transfers; Danny McCarthy was the runner-up with 4,645 votes on the last count, not so very far behind Cedric Wilson who finished on 4,804 (Kieran McCarthy's surplus of 70 votes had not been distributed).
Ulster Unionist Party (UUP) 12,547 (31%) 2 seats (John Taylor,
Thomas Benson elected)
Democratic Unionist Party (DUP) 11,584 (29%) 2 seats (Iris
Robinson, Jim Shannon elected)
Alliance Party of Northern Ireland (APNI) 4,614 (12%) 1 seat
(Kieran McCarthy elected)
United Kingdom Unionist Party (UKUP) 3,112 (8%)
Social Democratic and Labour Party (SDLP) 2,927 (7%)
Progressive Unionist Party (PUP) 2,017 (5%)
Ulster Democratic Party (UDP) 1,080 (3%)
Sinn Féin (SF) 709 (2%)
Northern Ireland Women's Coalition (NIWC) 410 (1%)
Conservative Party (Con) 380 (1%)
Green Party 213 (1%)
Labour (Lab) 202 (1%)
Workers Party (WP) 73 (0.18%)
Ulster's Independent Voice (UIV) 66 (0.16%)
Ulster Independence Movement (UIM) 57 (0.14%)
Democratic Left (DL) 53 (0.13%)
Independent Chambers 13 (0.03%)
Natural Law Party (NLP) 13 (0.03%)
Electorate: 69,093; votes cast: 40,114 (58.0%); spoilt votes: 44 (0.1%); valid votes: 40,070
Jim Shannon appears as "Richard Shannon" in some records. Thanks to Christopher Stalford of South Belfast DUP for clearing this up to me. John Taylor had been elected to the old Northern Ireland House of Commons, representing Tyrone South, in 1965; he was elected to the 1973 Assembly for Fermanagh and South Tyrone and to the 1975 Constitutional Convention and the 1982 Assembly for North Down.
| DUP | UKUP | UUP | Oth U | Alliance | Oth | SDLP | SF | |
| 2007a |
50% | 2% | 18% | 2% | 11% | 4% | 9% | 3% |
| 2005w | 56% | 21% | 4% | 9% | 7% | 3% | ||
| 2005lg | 49% | 23% | 0% | 14% | 4% | 7% | 2% | |
| 2003a | 48% | 29% | 3% | 7% | 2% | 8% | 3% | |
| 2001w | 43% | 40% | 2% | 7% | 6% | 2% | ||
| 2001lg | 37% | 30% | 1% | 15% | 8% | 8% | 1% | |
| 1998a | 28% | 7% | 29% | 12% | 12% | 1% | 9% | 1% |
| 1997lg | 27% | 1% | 32% | 2% | 20% | 9% | 9% | |
| 1997w | 30% | 44% | 4% | 13% | 0% | 7% | 1% | |
| 1996f | 29% | 8% | 31% | 9% | 12% | 2% | 7% | 2% |
See also: Full 2003 results from Strangford | Full 1998 results from Strangford | The Boundary Commission's Provisional Recommendations | Boundary Commission 2003 | Jim Riley's analysis of votes and seats in the 1998 Assembly election | The constituencies
Other sites based at ARK: ORB (Online Research Bank) | CAIN (Conflict Archive on the INternet) | Northern Ireland Life and Times Survey
Your comments, please! Send an email to me at nicholas.whyte@gmail.com.
 |
This page has been developed with the support of a project grant from the New Initiatives Fund of the Electoral Commission. However, any views expressed on this page or, in particular, other pages of this website are those of the author and not necessarily shared by The Electoral Commission. |
Nicholas Whyte, 3 June 1998; last updated 7 May 2022 by Conal Kelly.
|
Disclaimer:� Nicholas Whyte 1998-2007
|