

| |
|
|
|
|
|
|
 |
| Map and graph by Conal Kelly | |
 |
This constituency takes in the northern quarter of Belfast City
Council and adjacent parts of Antrim and Newtownabbey District
Council. The member of parliament has been John Finucane since the
2019 election; he defeated Nigel Dodds (DUP) who had represented
the constituency since 2001. Dodds had defeated Cecil Walker (UUP)
who had represented North Belfast between 1983 and 2001. The DUP
and Sinn Féin each hold two of the Assembly seats and Alliance
one. See also 1983-1992 North Belfast results, 1973-82 North
Belfast results and 1950-1970 North Belfast results.
2024 Westminster election candidates
2019 Westminster notional result on new boundaries:
SF 23,158 (48.1%)
DUP 19,419 (40.3%)
Alliance 5,099 (10.6%)
SDLP 225 (0.5%)
UUP 161 (0.3%)
PBP 57 (0.1%)
Aontu 16 (0.0%)
Conservative 5 (0.0%)
| DUP | UUP | Cons | Alliance | PBP | SDLP | SF | Aontu | ||
| 2019 actual |
21,135 | 4,824 | 23,078 | ||||||
| 43.1% | 9.8% | 47.1% | |||||||
| From North Belfast |
To North Belfast | 18,103 | 4,437 | 22,686 | |||||
| From North Belfast | To West Belfast | -2,863 | -348 | -208 | |||||
| From North Belfast | To South Antrim | -169 | -38 | -184 | |||||
| From West Belfast | To North Belfast | 1,071 | 45 | 57 | 28 | 195 | 16 | ||
| From South Antrim |
To North Belfast | 157 | 132 | 563 | 192 | 267 | 0 | ||
| From East Antrim |
To North Belfast | 89 | 29 | 5 | 54 | 5 | 11 | 0 | |
| 2019 notional | 19,419 | 161 | 5 | 5,099 | 57 | 225 | 23,158 | 16 | |
| 40.3% | 0.3% | 0.0% | 10.6% | 0.1% | 0.5% | 48.1% | 0.0% | ||
| -2.8% | 0.3% | 0.0% | 0.8% | 0.1% | 0.5% | 1.0% | 0.0% |
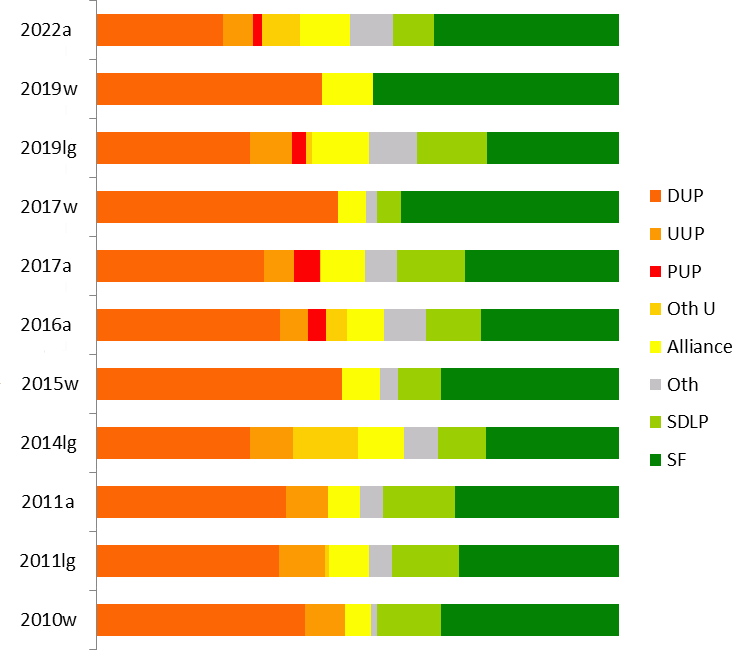
| DUP | UUP | Oth U | Alliance | Oth | SDLP | SF | |
| 2024w | 29.8% |
7.1% |
10.6% |
5.3% |
3.5% |
43.7% |
|
| 2022a | 24.3% | 5.7% | 8.9% | 9.5% | 8.3% | 7.8% | 35.5% |
| 2019w | 43.1% | 9.8% | 47.1% | ||||
| 2019lg | 29.3% | 8.0% | 3.8% | 11.2% | 9.2% | 13.4% | 25.2% |
| 2017w | 46.2% | 5.4% | 2.2% | 4.5% | 41.7% | ||
| 2017a | 32.1% | 5.8% | 5.1% | 8.4% | 6.1% | 13.1% | 29.4% |
| 2016a | 35.0% | 5.4% | 7.3% | 7.0% | 7.7% | 10.6% | 26.5% |
| 2015w | 47.0% | 7.2% | 3.6% | 8.2% | 33.9% | ||
| 2014lg | 29.4% | 8.4% | 12.3% | 8.9% | 6.4% | 9.3% | 25.4% |
| 2011a | 37.1% | 8.2% | 6.3% | 4.5% | 14.0% | 31.9% | |
| 2011lg | 35.1% | 8.7% | 0.8% | 7.6% | 4.4% | 12.9% | 30.5% |
| 2010w | 40.0% | 7.7% | 4.9% | 1.1% | 12.3% | 34.0% | |
| 2007a | 35.6% | 9.6% | 5.0% | 3.2% | 2.4% | 14.4% | 29.8% |
| 2005w | 43.0% | 9.5% | 2.9% | 0.9% | 16.7% | 27.0% | |
| 2005lg | 36.2% | 10.3% | 5.4% | 2.2% | 4.4% | 16.8% | 24.5% |
NB that the figures for elections before 2010 are projections.
Figures for the previous boundaries can be found at the bottom of
this page.
| @Gerry Kelly (SF) 8,395 (18.2%) @Carál Ní Chuilín (SF) 7,932 (17.2%) Phillip Brett (DUP) 6,329 (13.8%) Brian Kingston (DUP) 4,844 (10.5%) Nuala McAllister (Alliance) 4,381 (9.5%) Nichola Mallon (SDLP) 3,604 (7.8%) Ron McDowell (TUV) 3,335 (7.2%) Julie-Anne Corr-Johnston (UUP) 2,643 (5.7%) Mal O'Hara (Green) 1,446 (3.1%) Fiona Ferguson (PBP) 1,059 (2.3%) Billy Hutchinson (PUP) 762 (1.7%) Sean Mac Niocaill (Aontú) 640 (1.4%) Stafford Ward (Ind) 489 (1.1%) Lily Kerr (WP) 168 (0.4%) |
SF 16,327 (35.5%, +6.1%) 2 seats DUP 11,173 (24.3%, -7.8%) 2 seats Alliance 4,381 (9.5%, +1.1%) 1 seat SDLP 3,604 (7.8%, -5.3%) (-1) TUV 3,335 (7.2%) UUP 2,643 (5.7%, -0.1%) Green 1,446 (3.1%, +1.4%) PBP 1,059 (2.3%, -1.5%) PUP 762 (1.7%, -3.2%) Aontú 640 (1.4%) Ind 489 (1.1%) WP 168 (0.4%, -0.2%) Electorate: 75,801 Votes cast: 46,796 (61.7%), spoilt votes 769 (1.6%) Valid votes: 46,027, quota 7,672 |
One of the SDLP's four losses to Alliance. Infrastructure
Minister Nichola Mallon (SDLP) lost out on the final count to
Nuala McAllister (Alliance) by 991.21 votes, with 782 Unionist
surplus votes undistributed which would only have widened the gap.
Impressive balancing by Sinn Fein saw both of their candidates
returned on the first count. This was the Workers Party's best
result of the election.
John Finucane (SF) 23,078 (47.1%, +5.4%)
*Nigel Dodds (DUP) 21,135 (43.1%, -3.1%)
Nuala McAllister (Alliance) 4,824 (9.8%, +4.4%)
* outgoing MP.
Electorate: 72,225; Total Poll: 49,425 (68.4%); Invalid Votes:
388 (0.8%); Valid Votes: 49,037
Sinn Fein's only gain of the election; the absence of the SDLP
and the Greens made the difference, although the DUP appear to
have lost ground to the Alliance also. Nigel Dodds had the fourth
highest personal vote tally in Northern Ireland; but John Finucane
had the third highest. This is the only seat where SF's vote share
increased. In a five-seat Assembly election, these votes would
give SF and the DUP two each with the last one going to SF or
Alliance.
From the 2011 census, North Belfast includes:
The entire Belfast DEA of Castle
The entire Belfast DEA of Oldpark
26% of the Belfast DEA of Court
and
83% of the Antrim and Newtownabbey DEA of Macedon
67% of the Antrim and Newtownabbey DEA of Glengormley Urban.
With some adjustment for voter community background, I project
the 2019 results as:
DUP 10,642 (29.3%)
SF 9,148 (25.2%)
SDLP 4,876 (13.4%)
Alliance 4,080 (11.2%)
UUP 2,912 (8.0%)
Green 1,379 (3.8%)
PUP 928 (2.6%)
PBP 831 (2.3%)
Inds 831 (2.3%)
WP 296 (0.8%)
TUV 290 (0.8%)
UKIP 133 (0.4%)
*Nigel Dodds (DUP) 21,240 (46.2%, -0.8%)
John Finucane (SF) 19,159 (41.7%, +7.8%)
Sam Nelson (Alliance) 2,475 (5.4%, -1.8%)
Martin McAuley (SDLP) 2,058 (4.5%, -3.7%)
Malachai O'Hara (Green) 644 (1.4%)
Gemma Weir (WP) 360 (0.8%, -1.5%)
* outgoing MP.
@ member of the Assembly.
Electorate: 68,249; Total Poll: 46,107 (67.6%); Invalid Votes:
158 (0.3%); Valid Votes: 45,949
It was a tight margin for Dodds, but he retained the seat with
more votes than SF and the SDLP combined. If cast in a five-seat
Assembly election, this would have given the DUP and SF two seats
each, with the last more likely to fall to the DUP.
| @Gerry Kelly (SF) 6,275 (15.1%) @Carál Ní Chuilín (SF) 5,929 (14.3%) @Nichola Mallon (SDLP) 5,431 (13.1%) @Paula Bradley (DUP) 4,835 (11.7%) @William Humphrey (DUP) 4,418 (10.6%) @Nelson McCausland (DUP) 4,056 (9.8%) Nuala McAllister (Alliance) 3,487 (8.4%) Robert Foster (UUP) 2,418 (5.8%) Julie-Anne Corr-Johnston (PUP) 2,053 (4.9%) Fiona Ferguson (PBP) 1,559 (3.8%) Malachai O'Hara (Green) 711 (1.7%) Gemma Weir (WP) 248 (0.6%) Adam Millar (Ind) 66 (0.2%) |
DUP 13,309 (32.1%, -2.9%) 2 seats (-1) SF 12,204 (29.4%, +2.9%) 2 seats SDLP 5,431 (13.1%, + 2.5%) 1 seat Alliance 3,487 (8.4%, + 1.4%) UUP 2,418 (5.8%, +0.4) PUP 2,053 (4.9%, +1.5%) PBP 1,559 (3.8%, +0.3%) Green 711 (1.7%, -0.5%) WP 248 (0.6%, -0.7%) Ind 66 (0.2%) Electorate: 68,187 Votes cast: 42,119 (61.8%, +9.3%), spoilt votes 633 (1.5%) Valid votes: 41,486, quota 6,915 |
Outgoing MLA Nelson McCausland (DUP) was never really in the
frame, and was overtaken by Nuala McCallister (Alliance) who ended
the count 556 votes behind SF's Car�l N� Chuil�n. The three
Nationalist candidates were very well-balanced, and managed to get
three seats from 42.4% of first preferences, while Unionists got
only two seats from 42.8%.
Geoff Dowey of NI First got the lowest number of first
preferences of any candidate in the election.
| @Gerry Kelly (Sinn Féin) 5,695 @Paula Bradley (DUP) 4,591 @William Humphrey (DUP) 4,105 @Nelson McCausland (DUP) 4,087 @Carál Ní Chuilín (Sinn Féin) 4,009 Nichola Mallon (SDLP) 3,866 Nuala McAllister (Alliance) 2,569 Lesley Carroll (UUP) 1,972 Fiona Ferguson (PBP) 1,286 Billy Hutchinson (PUP) 1,238 Malachai O'Hara (Green) 796 Ken Boyle (UKIP) 751 John Miller (TUV) 644 Gemma Weir (WP) 476 Fra Hughes (Ind) 243 Abdo Thabeth (NILRC) 127 Tom Burns (Ind) 87 Geoff Dowey (NI First) 32 |
DUP 12,783 (35.0%, -2.1%) 3 seats SF 9,704 (26.5%, -5.4%) 2 seats SDLP 3,866 (10.6%, -1.4%) 1 seat Alliance 2,569 (7.0%, +0.9%) UUP 1,972 (5.4%, -2.8%) PBP 1,286 (3.5%) PUP 1,238 (3.4%) Green 796 (2.2%) UKIP 751 (2.1%) TUV 644 (1.8%) WP 476 (1.3%, +0.3%) Inds 330 (0.9%) NILRC 127 (0.3%) NI First 32 (0.1%) Electorate: 70,872 Votes cast: 37,193 (52.5%, +2.2%), spoilt votes 619 (1.7%) Valid votes 36,574, quota 5,225 |
No change among the parties with all six sitting MLAs re-elected.
Nuala McAllister (Alliance) was 1011.68 behind Nicola Mallon
(SDLP) on the last count, with 744 undistributed DUP surplus votes
which would have narrowed the gap.
Geoff Dowey of NI First got the lowest number of first
preferences of any candidate in the election.
*Nigel Dodds (DUP) 19,096 (47.0%, +7.0%)
Gerry Kelly (SF) 13,770 (33.9%, -0.1%)
Alban Maginness (SDLP) 3,338 (8.2%, -4.1%)
Jason O'Neill (Alliance) 2,941 (7.2%, +2.4%)
Gemma Weir (WP) 919 (2.3%)
Fra Hughes (Ind) 529 (1.3%)
Electorate: 68,553; Total Poll: 40,887 (59.6%); Invalid Votes: 294
(0.7%); Valid Votes: 40,593
Dodds benefited from the DUP's pact with the UUP, though in fact
on recent electoral showings he didn't need it and would have won
anyway.
If cast in a six-seat Assembly election, these votes would give
the DUP three seats, SF two and the SDLP one, with Alliance
challenging strongly for the last place.
From the 2011 census, North Belfast includes:
The entire Belfast DEA of Castle
The entire Belfast DEA of Oldpark
26% of the Belfast DEA of Court
and
83% of the Antrim and Newtownabbey DEA of Macedon
67% of the Antrim and Newtownabbey DEA of Glengormley Urban.
With some adjustment for voter community background, I project
the 2014 results as:
DUP 9342 (29%)
SF 8076 (25%)
SDLP 2950 (9%)
Alliance 2840 (9%)
PUP 2732 (9%)
UUP 2668 (8%)
TUV 1191 (4%)
Inds 1069 (3%)
NI21 510 (2%)
WP 432 (1%)
| @Gerry Kelly (SF) 6,674 (19.9%) @Nelson McCausland (DUP) 5,200 (15.5%) @Alban Maginness (SDLP) 4,025 (12.0%) @William Humphrey (DUP) 3,724 (11.1%) Paula Bradley (DUP) 3,488 (10.4%) @Carál Ní Chuilín (SF) 2,999 (9.0%) @Fred Cobain (UUP) 2,758 (8.2%) Billy Webb (Alliance) 2,096 (6.3%) Raymond McCord (Independent) 1,176 (3.5%) J.J. Magee (SF) 998 (3.0%) John Lavery (WP) 332 (1.0%) @ member of the Assembly when it was dissolved. |
DUP 12,412 (37.1%, +1.5%)
3 seats SF 10,671 (31.9%, +2.1%) 2 seats SDLP 4,025 (12.0%, -2.4%) 1 seat UUP 2,758 (8.2%, -1.4%) (-1) Alliance 2,096 (6.3%, +3.1%) Ind 1,176 (3.5%, -0.9%) WP 332 (1.0%, +0.5%) Electorate: 68,119 Votes cast: 34,280 (50.3%), spoilt votes 810 (2.4%) Valid votes 33,470, quota 4,782 |
One of the DUP's gains, here from the UUP's Fred Cobain who finally ebbed beneath the level of viability; he was 442 votes behind the DUP's Paul Bradley on the last count, with 328 Nationalist surplus votes undistributed. On previous counts, Bradley had picked up twice as many Natonalist transfers as Cobain, so the real margin of defeat is probably greater.
*@Nigel Dodds (DUP) 14,812
(40.0%, -5.6%)
@Gerry Kelly (Sinn Féin) 12,588 (34.0%, +5.4%)
@Alban Maginness (SDLP) 4,544 (12.3%, -3.9%)
@Fred Cobain (UCUNF) 2,837 (7.7%, +0.6%)
William Webb (Alliance) 1,809 (4.9%, +3.5%)
Martin McAuley (Independent) 403 (1.1%)
Electorate: 65,504; Total Poll: 37,233 (56.8%); Invalid Votes: 240
(0.6%); Valid Votes: 36,993
* incumbent
@ elected to the Northern Ireland Assembly from this constituency
Dodds will be happy to have retained his seat, but SF have been gradually closing the gap here over the last couple of elections. These votes, if cast in a six-seat Assembly election, would give the DUP and SF two seats each, the SDLP one, and the last seat between a third DUP candidate, the UUP and possibly Alliance.
| *Nigel Dodds MP (DUP)
6973 (23.5%) *Gerry Kelly (SF) 5414 (18.2%) Carál Ní Chuilín (SF) 3680 (12.4%) *Fred Cobain (UUP) 2498 (8.4%) *Nelson McCausland (DUP) 2462 (8.3%) *Alban Maginness (SDLP) 2212 (7.4%) Pat Convery (SDLP) 1868 (6.3%) William Humphrey (DUP) 1673 (5.6%) Raymond McCord (Independent) 1320 (4.4%) Peter Emerson (Green) 590 (2.0%) Thomas McCullough (Alliance) 486 (1.6%) ^Robert McCartney (UKUP) 360 (1.2%) John Lavery (WP) 139 (0.5%) Rainbow George (Make Politicians History) 40 (0.1%) *Elected in 2003 from North Belfast ^Elected in 2003 from North Down |
DUP 11,108 (37.4%, +3.2%) 2 seats SF 9,094 (30.6%, +3.6%) 2 seats SDLP 4,080 (13.7%, -3.1%) 1 seat UUP 2,498 (8.4%, -1.0%) 1 seat Ind 1,320 (4.4%) Green 590 (2.0%, +1.2%) Alliance 486 (1.6%, +0.7%) UKUP 360 (1.2%) WP 139 (0.5%, +0.2%) Rainbow George 0.1% (+0.1%) Electorate 49,372 Votes cast 30,067 (60.9%); spoilt votes 352 (1.2%) Valid votes 29,715; quota 4,246 |
*@ Nigel Dodds (DUP) 13935 (45.6% +4.8%)
@Gerry Kelly (Sinn Fein) 8747 (28.6% +3.4%)
@Alban Maginness (SDLP) 4950 (16.2% -4.8%)
@Fred Cobain (UUP) 2154 (7.1% -4.9%)
Marjorie Hawkins (Alliance) 438 (1.4%)
Marcella Delaney (Workers Party) 165 (0.5% -0.1%)
Lynda Gilby (Vote for Yourself Rainbow Dream Ticket) 151 (0.5%
+0.3%)
* outgoing MP.
@ Member of the Assembly
These votes, if cast in a six-seat STV election, would give the DUP three seats, SF two and the SDLP one.
DUP 11,147.7 (37.0%)
Sinn Fein 8,028.1 (26.6%)
SDLP 5,007.7 (16.6%)
UUP 2,775.2 (9.2%)
PUP 1,017.1 (3.4%)
Newtownabbey Ratepayers Assoc 684.2 (2.3%)
Green 432 (1.4%)
Alliance 270 (0.9%)
Independents 802.6 (2.7%)
Extrapolating from the local government elections is tricky because the North Belfast constituency breaches two local electoral area boundaries. If we make some reasonable adjustments, we get these figures for the whole North Belfast constituency. The DUP, and SF would get two seats each, and the SDLP one, with the last between the UUP and a third DUP runner.
| *Nigel Dodds (DUP) 9276 (29.4%) *Gerry Kelly (SF) 5524 (17.5%) *Alban Maginness (SDLP) 3186 (10.1%) Kathy Stanton (SF) 2990 (9.5%) *Fred Cobain (UUP) 2961 (9.4%) Pat Convery (SDLP) 2108 (6.7%) Nelson McCausland (DUP) 1500 (4.8%) *Billy Hutchinson (PUP) 1358 (4.3%) *Fraser Agnew (UUC) 802 (2.5%) Frank McCoubrey (Ind) 469 (1.5%) Eliz Byrne McCullough (NIWC) 467 (1.5%) Marjorie Hawkins (Alliance) 305 (1.0%) Peter Emerson (Green) 261 (0.8%) Raymond McCord (Ind) 218 (0.7%) Marcella Delaney (WP) 90 (0.3%) John Gallagher (VFYS) 17 (0.1%) |
DUP 10,776 (34.2%, +12.9%) SF 8,514 (27.0%, +5.7%) SDLP 5,294 (16.8%, -4.3%) UUP 2,961(9.4%, -1.5%) PUP 1,358 (4.3%, -4.8%) UUC 802 (2.5%) Inds 687 (2.2%) NIWC 467 (1.5%) Alliance 305 (1.0%, -2.1%) Green 261 (0.8%, +0.2%) WP 90 (0.3%, -0.1%) VFYS 17 (0.1%) Electorate 51,353 |
Reaction: As widely predicted, DUP and SF took extra seats at the expense of Agnew and Hutchinson. The final result was not even close, with 1521 votes separating Stanton and Hutchinson, and an undistributed SDLP surplus of 1064 which would only have widened the gap.
North Belfast had lost 15.90% of its electorate in the great electoral register shake-out, varying from 23.46% in the Ardoyne ward of Belfast to 9.86% in Cavehill ward, also in Belfast. 15 constituencies lost fewer voters, only South and West Belfast lost more.Electorate: 60,941; votes cast: 41,309 (67.7%); spoilt votes: 377
(0.9%)
Valid votes: 40,932; DUP majority 6,387
* outgoing MP.
@ Member of the Assembly
The least unexpected of the DUP's three gains in 2001, though the collapse of Walker's vote was dramatic - partly caused by a disastrous TV performance a few weeks before the election. If this had been a six-seat Assembly election, the DUP and SF would both have won two, the SDLP one, and the last seat would have been between the UUP and DUP.
DUP 10028.3 (25%)
SF 9867.3 (25%)
SDLP 6969 (18%)
UUP 4218.9 (11%)
PUP 3059.3 (8%) Best equivalent result in Northern Ireland
Alliance 1288.2 (3%)
Newtownabbey Ratepayers Association 541.7 (1%) Best result in
Northern Ireland
Women's Coalition 253 (1%)
Community Candidates 133.3 (0.3%)
Workers Party 84 (0.2%)
Ulster Third Way 11.2 (0.03%)
Independents 3407.0 (8%)
Total valid 39802.1
If we make some reasonable adjustments, we get these figures for the whole North Belfast constituency. And it is very tight. The DUP, SF and the SDLP certainly have a seat each. SF would be pretty likely to get a second seat. In that case there would be two more Unionist seats, with the DUP and UUP most likely to take them, but the PUP would have an outside chance.
| *Nigel Dodds (DUP) 7,476 votes *Alban Maginness (SDLP) 6,196 votes *Gerry Kelly (SF) 5,610 votes Billy Hutchinson (PUP) 3,751 votes Martina McIlkenny (SF) 3,165 votes Fraser Agnew (UU) 2,976 votes Martin Morgan (SDLP) 2,465 votes Fred Cobain (UUP) 2,415 votes *David Browne (UUP) 2,064 votes #Eric Smyth (DUP) 1,288 votes Glyn Roberts (All) 1,267 votes #John White (UDP) 911 votes Stephen Cooper (UKU) 748 votes Peter Emerson (Green) 257 votes Sam McAughtry (Lab) 255 votes Steven Doran (WP) 155 votes Kevin Blair (NLP) 76 votes Delores Quinn (Ind Nat Commty Cand) 50 votes |
SF 8,775 (21.34%) 1 seat
DUP 8,764 (21.31%) 1 seat SDLP 8,661 (21.06%) 1 seat UUP 4,479 (10.89%) 1 seat PUP 3,751 (9.12%) 1 seat UU 2,976 (7.24%) 1 seat All 1,267 (3.08%) UDP 911 (2.22%) UKU 748 (1.82%) Green 257 (0.62%) Lab 255 (0.62%) WP 155 (0.38%) NLP 76 (0.18%) Ind NCC 50 (0.12%) Electorate 62,541 |
* elected in 1996 Forum/talks election from North Belfast
# elected in 1996 Forum/talks election as a 'top-up' candidate.
The success of 'Ulster Unionist' Fraser Agnew, and the failure of any of the three main parties (SDLP, SF, DUP) to win a second seat, made North Belfast one of the shock results of the election. The UUP polled a mere 11% in a constituency which they represent at Westminster, and were lucky to beat the SDLP's Martin Morgan for the last seat, by 4,971 votes to 4,682. North Belfast remains Northern Ireland's most fissiparous seat.
Sinn Féin 7,682 (22%)
Ulster Unionist Party 6,707.4 (20%)
Social Democratic and Labour Party 4,807 (14%)
Democratic Unionist Party 4,707.1 (14%)
Progressive Unionist Party 3,120 (9%)
Alliance Party of Northern Ireland 1,750.8 (5%)
Ulster Democratic Party 1491.3 (4%)
Labour 919.2 (3%)
Newtownabbey Ratepayers Association 397.5 (1%)
Northern Ireland Labour 327.5 (1%)
Green Party 318 (1%)
Women's Coalition 209 (1%)
United Kingdom Unionist Party 187.5 (1%)
Workers Party 162 (0.47%)
Ulster Independence Movement 8 (0.02%)
Natural Law Party 5 (0.01%)
Others 799.5 (2%)
Total valid 34162.3 (52.67% of electorate)
* outgoing MP
ƒ Member of the Forum
Democratic Unionist Party (DUP) 7,778 (19%); Nigel Dodds, William
Snoddy elected
Sinn Féin (SF) 7,681 (19%); Gerry Kelly elected
Social Democratic and Labour Party (SDLP) 7,493 (19%); Alban
Maginness elected
Ulster Unionist Party (UUP) 6,938 (17%); David Browne elected
Progressive Unionist Party (PUP) 3,777 (9%)
Ulster Democratic Party (UDP) 1,874 (5%)
Alliance Party of Northern Ireland (APNI) 1,670 (4%)
United Kingdom Unionist Party (UKUP) 1,329 (3%)
Labour 571 (1%)
Northern Ireland Women's Coalition (NIWC) 486 (1%)
Workers Party 274 (WP) (1%)
Green Party 265 (1%)
Democratic Left (DL) 123 (0.30%)
Ulster's Independent Voice (UIV) 63 (0.16%)
Ulster Independence Movement (UIM) 41 (0.10%)
Independent McMullan 25 (0.06%)
Independent Chambers 21 (0.05%)
Electorate: 65,411; votes cast: 40,528 (61.9%); spoilt votes: 105 (0.2%); valid votes: 40,423
I was the lead candidate on Alliance's list for the 1996 Forum elections, and had been selected as the prospective parliamentary candidate for the Westminster election, before I went to work in Bosnia and withdrew (for the time being) from active politics in Northern Ireland. In the end I am certain that Tom Campbell got a better result in 1997 than I would have.
If the 1996 Forum election had been to elect six delegates by STV, and the voters' choice of parties translated directly to first-preferences for candidates, the DUP, the UUP, Sinn Fein, the SDLP and probably the PUP would all have won one seat. The last seat would have been an awfully tight squeeze between the second candidates of the DUP, the UUP, Sinn Fein, and the SDLP. Although the UUP and SDLP would have had fewer first preferences than DUP and Sinn Fein, they would both have benefited from transfers (from me!) to pull them ahead, and the UUP would probably have just shaded it.
| DUP | UUP | PUP | Oth U | Alliance | Oth | SDLP | SF | |
| 2007a | 37% | 8% | 6% | 2% | 3% | 14% | 31% | |
| 2005w | 46% | 7% | 1% | 1% | 16% | 29% | ||
| 2005lg | 37% | 9% | 3% | 1% | 6% | 17% | 27% | |
| 2003a | 34% | 9% | 4% | 4% | 1% | 2% | 17% | 27% |
| 2001w | 41% | 12% | 1% | 21% | 26% | |||
| 2001lg | 25% | 11% | 8% | 3% | 11% | 18% | 25% | |
| 1998a | 21% | 11% | 9% | 11% | 3% | 2% | 21% | 21% |
| 1997lg | 14% | 20% | 9% | 5% | 5% | 9% | 14% | 22% |
| 1997w | 52% | 5% | 2% | 20% | 20% | |||
| 1996f | 19% | 17% | 9% | 8% | 4% | 5% | 19% | 19% |
See also: Full 2003 results from North Belfast | Full 1998 results from North Belfast | The Boundary Commission's Provisional Recommendations | Boundary Commission 2003 | Jim Riley's analysis of votes and seats in the 1998 Assembly election | The constituencies
Other sites based at ARK: ORB (Online Research Bank) | CAIN (Conflict Archive on the INternet) | Northern Ireland Life and Times Survey
Your comments, please! Send an email to me at nicholas.whyte@gmail.com.
 |
This page has been developed with the support of a project grant from the New Initiatives Fund of the Electoral Commission. However, any views expressed on this page or, in particular, other pages of this website are those of the author and not necessarily shared by The Electoral Commission. |
Nicholas Whyte, 3 June 1998; last updated 7 May 2022 by Conal Kelly.
|
Disclaimer:� Nicholas Whyte 1998-2015
|