

| |
|
|
|
|
|
|
 |
| Map and graph by Conal Kelly |
|
This constituency stretches along the coastal strip on the
northern side of Belfast Lough and the western side of the North
Channel. It takes in the central and eastern chunks of Mid and East Antrim District Council, the
easternmost part of Antrim and Newtownabbey
District Council, and the easternmost corner of Causeway Coast and Glens District Council.
The DUP and Alliance hold two Assembly seats each, and the UUP
one. The member of parliament since 2005 is Sammy Wilson (DUP); he
defeated Roy Beggs (UUP), who had represented East Antrim since it
was created in 1983 (see 1983-92 East Antrim
results).
2019 Westminster notional result on new boundaries:
| DUP | UUP | Cons | Alliance | Green | SDLP | SF | ||
| 2019 actual |
16,871 | 5,475 | 1,043 | 10,165 | 685 | 902 | 2,120 | |
| 45.3% | 14.7% | 2.8% | 27.3% | 1.8% | 2.4% | 5.7% | ||
| From East Antrim |
To East Antrim | 16,282 | 5,284 | 1,007 | 9,810 | 685 | 870 | 2,046 |
| From East Antrim | To North Antrim | -272 | -88 | -17 | -164 | 0 | -15 | -34 |
| From East Antrim | To South Antrim | -229 | -74 | -14 | -138 | 0 | -12 | -29 |
| From East Antrim | To North Belfast | -89 | -29 | -5 | -54 | 0 | -5 | -11 |
| From North Antrim | To East Antrim | 482 | 1,342 | 583 | 0 | 553 | 1,057 | |
| From SouthAntrim | To East Antrim | 55 | 45 | 30 | 0 | 8 | 18 | |
| 2019 notional |
16,818 | 6,671 | 1,007 | 10,423 | 685 | 1,432 | 3,120 | |
| 41.9% | 16.6% | 2.5% | 26.0% | 1.7% | 3.6% | 7.8% | ||
| -3.4% | +1.9% | -0.3% | -1.3% | -0.1% | +1.1% | +2.1% |
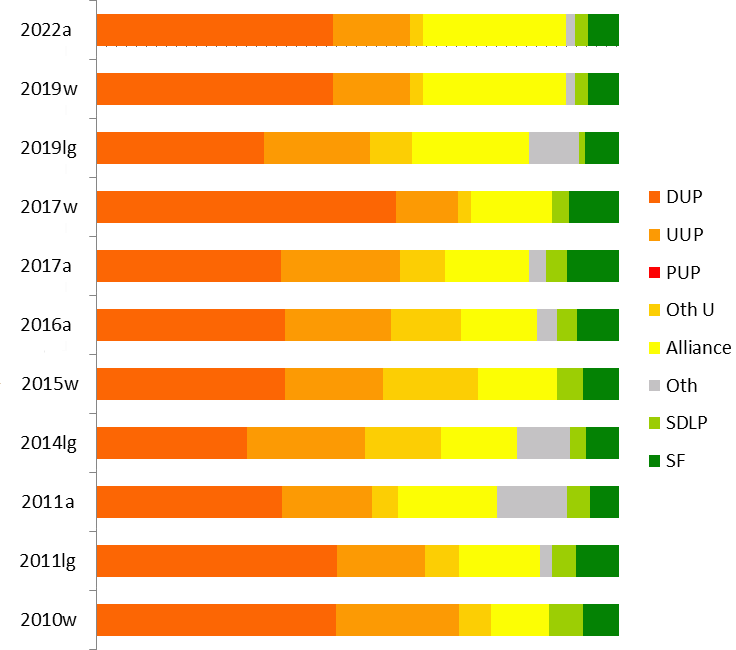
| DUP | UUP | Oth U | Alliance | Oth | SDLP | SF | |
| 2024w | 28.9% |
23.9% |
10.4% |
25.6% |
1.4% |
2.3% |
7.5% |
| 2022a | 29.6% | 24.2% | 9.1% | 23.1% | 1.9% | 3.0% | 9.1% |
| 2019w | 45.3% | 14.7% | 2.8% | 27.3% | 1.8% | 2.4% | 5.7% |
| 2019lg | 32.0% | 20.3% | 8.2% | 22.4% | 9.5% | 1.2% | 6.5% |
| 2017w | 57.3% | 11.9% | 2.5% | 15.6% | 3.4% | 9.3% | |
| 2017a | 35.2% | 22.7% | 8.7% | 16.1% | 3.4% | 4.1% | 9.9% |
| 2016a | 36.1% | 20.2% | 13.3% | 14.6% | 3.8% | 3.8% | 8.1% |
| 2015w | 36.1% | 18.8% | 18.2% | 15.0% | 4.9% | 6.9% | |
| 2014lg | 28.9% | 22.6% | 14.5% | 14.6% | 10.1% | 3.1% | 6.3% |
| 2011a | 46.2% | 16.9% | 6.4% | 15.5% | 2.3% | 4.6% | 8.2% |
| 2011lg | 35.6% | 17.2% | 4.9% | 19.1% | 13.3% | 4.5% | 5.4% |
| 2010w | 45.9% | 23.7% | 6.0% | 11.1% | 6.6% | 6.8% | |
| 2007a |
42.8% | 20.6% | 2.3% | 15.0% | 4.6% | 8.0% | 6.7% |
| 2005w | 46.9% | 25.1% | 14.7% | 7.4% | 5.4% | ||
| 2005lg | 36.7% | 21.2% | 1.5% | 16.7% | 14.6% | 5.1% | 4.2% |
NB that the figures for elections before 2010 are projections.
Figures for the previous boundaries can be found at the bottom of
this page.
NB also that the Conservatives supported the UUP candidate(s) in
2010 and 2011.
| @Gordon Lyons (DUP) 6,256 (15.5%) @John Stewart (UUP) 6,195 (15.4%) @David Hilditch (DUP) 5,662 (14.1%) @Stewart Dickson (Alliance) 5,059 (12.6%) Danny Donnelly (Alliance) 4,224 (10.5%) Oliver McMullan (SF) 3,675 (9.1%) Norman Boyd (TUV) 3,661 (9.1%) @Roy Beggs Jr (UUP) 3,549 (8.8%) Siobhán McAlister (SDLP) 1,200 (3.0%) Mark Bailey (Green) 754 (1.9%) @ member of the Assembly when it was dissolved. |
DUP 11,918 (29.6%, -5.6%) 2 seats UUP 9,744 (24.2%, +1.5%) 1 seat (-1) Alliance 9,283 (23.1%, +7.0%) 2 seats SF 3,675 (9.1%, -0.8%) TUV 3,661 (9.1%, +5.0%) SDLP 1,200 (3.0%, -1.1%) Green 754 (1.9%, -0.2%) Electorate: 67,699 Votes cast: 40,693 (60.1%, ±0%), spoilt votes 458 (1.1%) Valid votes: 40,235, quota 6,706 |
*Sammy Wilson (DUP) 16,871 (45.3%, -12.1%)
Danny Donnelly (Alliance) 10,165 (27.3%, +11.7%)
@Steve Aiken (UUP) 5,475 (14.7%, +2.8%)
Oliver McMullan (SF) 2,120 (5.7%, -3.6%)
Aaron Rankin (Cons) 1,043 (2.8%, +0.3%)
Angela Mulholland (SDLP) 902 (2.4%, -0.9%)
Philip Randle (Green) 685 (1.8%, +1.8%)
* outgoing MP.
@ member of the Assembly.
Electorate: 64,830; Total Poll: 37,431 (57.7%); Invalid Votes:
170 (0.5%); Valid Votes: 37,261
Wilson successfully returned for the fifth time. Alliance drew
votes directly from both DUP and SF here, more from DUP because
there were more to draw from. In a five-seat Assembly election,
these votes would give the DUP and Alliance two seats each. The
last one would between the UUP and a third DUP, with the former
more likely.
From the 2011 census, East Antrim includes:
The entire Mid and East Antrim DEA of Carrick Castle
The entire Mid and East Antrim DEA of Coast Road
The entire Mid and East Antrim DEA of Knockagh
The entire Mid and East Antrim DEA of Larne Lough
4% of the Mid and East Antrim DEA of Braid
and
58% of the Antrim and Newtownabbey DEA of Three Mile Water
13% of the Antrim and Newtownabbey DEA of Macedon
and
24% of the Causeway Coast and Glens DEA of The Glens
With some adjustment for voter community background, I project
the 2019 results as:
DUP 9,454 (32.0%)
Alliance 6,609 (22.4%)
UUP 5,984 (20.3%)
Inds 2,527 (8.6%)
SF 1,931 (6.5%)
TUV 1,572 (5.3%)
SDLP 342 (1.2%)
PUP 304 (1.0%)
UKIP 285 (1.0%)
DVP 265 (0.9%)
Green 256 (0.9%)
* outgoing MP.
@ member of the Assembly.
Electorate: 62,908; Total Poll: 38.629 (60.8%); Invalid Votes:
126 (0.3%); Valid Votes: 38,143
A thumping victory for Sammy Wilson. In a five-seat Assembly
election, this would elect three DUP candidates, one Alliance, and
a fourth Unionist - UUP unless the DUP did a very good job of
balancing.
| @David Hilditch (DUP)
6,000 (16.0%) @Roy Beggs (UUP) 5,121 (13.7%) @Stewart Dickson (Alliance) 4,179 (11.2%) @Gordon Lyons (DUP) 3,851 (10.3%) @Oliver McMullan (SF) 3,701 (9.9%) John Stewart (UUP) 3,377 (9.0%) Stephen Ross (DUP) 3,313 (8.9%) Danny Donnelly (Alliance) 1,817 (4.9%) Noel Jordan (UKIP) 1,579 (4.2%) Ruth Wilson (TUV) 1,534 (4.1%) Margaret McKillop (SDLP) 1,524 (4.1%) Dawn Patterson (Green) 777 (2.1%) Conor Sheridan (Cross Community Labour Alternative) 393 (1.1%) Alan Dunlop (Conservatives) 152 (0.4%) Ricky Best (Independent) 106 (0.3%) |
DUP 13,164 (35.2%, -0.9%) 2 seats (-1) UUP 8,498 (22.7%, +2.5%) 2 seats (+1) Alliance 5,996 (16.1%, +1.5%) 1 seat SF 3,701 (9.9%, +1.7%) (-1) UKIP 1,579 (4.2%, -2.4%) TUV 1,534 (4.1%, -1.0%) SDLP 1,524 (4.1%, +0.3%) Green 777 (2.1%, ±0%) Cross Community Labour Alternative 393 (1.1%, -0.6%) Conservatives 152 (0.4%) Independent 106 (0.3%) Electorate: 62,933 Votes cast: 37,836 (60.1%); spoilt 412 (1.1%) Valid votes: 37,424; Quota 6,238 |
| @David Hilditch (DUP) 5,906 @Roy Beggs (UUP) 3,848 @Gordon Lyons (DUP) 3,472 @Stewart Dickson (APNI) 3,115 @Oliver McMullan (SF) 2,633 @Alastair Ross (DUP) 2,323 Noel Jordan (UKIP) 2,207 John Stewart (UUP) 1,985 Ruth Wilson (TUV) 1,643 Danny Donnelly (APNI) 1,632 Margaret McKillop (SDLP) 1,229 Maureen Morrow (UUP) 719 Dawn Patterson (Green) 693 Conor Sheridan (Cross Community Labour Alternative) 551 Jim McCaw (PUP) 455 |
DUP 11,701 (36.1%, -10.1%) 3 seats
UUP 6,552 (20.2%, +3.3%) 1 seat Alliance 4,747 (14.6%, -0.9%) 1 seat SF 2,633 (8.1%, -0.1%) 1 seat UKIP 2,207 (6.8%) TUV 1,643 (5.1%, +0.5%) SDLP 1,229 (3.8%, -0.8%) Green 693 (2.1%, -0.2%) CCLA 551 (1.7%) PUP 455 (1.4%) Electorate: 64,194 Votes cast: 32,744 (51.0%); spoilt 333 (1.0%) Valid votes 32,411; quota 4,631 |
All six outgoing MLA's were re-elected, but this got very close
at the end. On the penultimate count, Stewart (UUP) was excluded
with 2926.89 votes, 126.42 less than Jordan (UKIP), with Ross
(DUP) less than 120 ahead of the UKIP candidate and McMullan (SF)
about 450 votes ahead of the DUP. Had Stewart's votes split evenly
and consistently between UKIP and the DUP, both Ross and Jordan
would have overtaken McMullan for the last seat. But in fact
almost half of Stewart's votes were non-transferable, with 900
going to the DUP, 500 to UKIP and 40 to SF; the result being that
SF held the last seat by a margin of 104.79 over UKIP. Might it
have been different if Jordan, or indeed Ross, had been behind
Stewart on the penultimate count? Their votes in either case could
have split more evenly between the two other Unionist candidates,
creating greater difficulty for McMullen.
*Sammy Wilson (DUP) 12,103 (36.1%, -9.7%)
Roy Beggs (UUP) 6,308 (18.8%, -4.8%)
Stewart Dickson (Alliance) 5,021 (15.0%, +3.9%)
Noel Jordan (UKIP) 3,660 (10.9%)
Oliver McMullan (SF) 2,314 (6.9%, +0.1%)
Ruth Wilson (TUV) 1,903 (5.7%, -0.3%)
Margaret Anne McKillop (SDLP) 1,639 (4.9%, -1.7%)
Alex Wilson (Conservative) 549 (1.6%)
Electorate: 62,811; Total Poll: 33,688 (53.6%); Invalid Votes: 191
(0.6%); Valid Votes: 33,497
A successful defence by Wilson, though with votes slipping to UKIP
who did very well here. The TUV vote, after encouraging local
elections in 2014, is not impressive.
If cast in a six-seat Assembly election, these votes would probably give the DUP two seats, and one each to the UUP, Alliance, UKIP and SF.
From the 2011 census, East Antrim includes:
The entire Mid and East Antrim DEA of Carrick Castle
The entire Mid and East Antrim DEA of Coast Road
The entire Mid and East Antrim DEA of Knockagh
The entire Mid and East Antrim DEA of Larne Lough
4% of the Mid and East Antrim DEA of Braid
and
58% of the Antrim and Newtownabbey DEA of Three Mile Water
13% of the Antrim and Newtownabbey DEA of Macedon
and
24% of the Causeway Coast and Glens DEA of The Glens
With some adjustment for voter community background, I project
the 2014 results as:
DUP 8013 (29%)
UUP 6253 (23%)
Alliance 4042 (15%)
TUV 2482 (9%)
Inds 2006 (7%)
SF 1745 (6%)
PUP 1523 (5%)
SDLP 853 (3%)
NI21 786 (3%)
| @Sammy Wilson MP (DUP) 7,181
(24.7%) @David Hilditch (DUP) 3,288 (11.3%) @Roy Beggs (UUP) 3,042 (10.5%) Stewart Dickson (Alliance) 2,889 (10.0%) Oliver McMullan (SF) 2,369 (8.2%) Rodney McCune (UUP) 1,851 (6.4%) Gerardine Mulvenna (Alliance) 1,620 (5.6%) @Alastair Ross (DUP) 1,608 (5.5%) Ruth Wilson (TUV) 1,346 (4.6%) Justin McCamphill (SDLP) 1,333 (4.6%) Gordon Lyons (DUP) (1,321) (4.6%) Daniel Donnelly (Green) 664 (2.3%) Steven Moore (BNP) 511 (1.8%) @ member of the Assembly when it was dissolved. |
DUP 13398 (46.2%, +0.7%) 3 seats UUP 4893 (16.9%, -5.0%) 1 seat (-1) Alliance 4509 (15.5%, -0.7%) 1 seat SF 2,369 (8.2%, +4.3%) 1 seat (+1) TUV 1,346 (4.6%) SDLP 1,333 (4.6%, -1.3%) Green 664 (2.3%, +0.3%) BNP 511 (1.8%) Electorate 61,617 Votes cast: 29,430 (47.8%); spoilt 407 (1.4%) Valid votes 29,023; quota 4,147 |
One of the most significant results of the election - the only
case where boundary changes which favoured Nationalists actually
resulted in a gain (whereas Unionists gained three Nationalist
seats for this reason). A good result for SF who were only 45
votes ahead of the SDLP in 2010 but outpolled them almost two to
one this time, and took the second UUP seat as a result. Alliance
came within 69 votes of a chance at a second seat; in the event
the runner up was McCune of the UUP, 499 votes behind McMullan.
*@Sammy Wilson (DUP) 13,993
(45.9%, -1.0%)
Rodney McCune (UCUNF) 7,223 (23.7%, -1.4%)
Gerry Lynch (Alliance) 3,377 (11.1%, -3.6%)
Oliver McMullan (Sinn Féin) 2,064 (6.8%, +1.4%)
Justin McCamphill (SDLP) 2,019 (6.6%, -0.8%)
Samuel Morrison (TUV) 1,826 (6.0%)
Electorate: 60,204; Total Poll: 30,640 (50.9%); Invalid Votes: 138
(0.5%); Valid Votes: 30,502
* incumbent
@ elected to the Northern Ireland Assembly from this constituency
A solid hold for Wilson, and another place where the TUV failed to break through. A six-seat Assembly election on these votes would get the DUP three seats, the UUP one for sure, and the last two probably going to SF and Alliance, though the UUP would be in with a chance of a second.
| *Sammy Wilson MP (DUP)
6755 (22.5%) *George Dawson (DUP) 4167 (13.9%) *Sean Neeson (Alliance) 3114 (10.4%) *Roy Beggs [jr] (UUP) 3076 (10.2%) *David Hilditch (DUP) 2732 (9.1%) *Ken Robinson (UUP) 1881 (6.3%) Daniel O'Connor (SDLP) 1769 (5.9%) Stewart Dickson (Alliance) 1624 (5.4%) Mark Dunn (UUP) 1617 (5.4%) Oliver McMullan (SF) 1168 (3.9%) Thomas Robinson (UKUP) 731 (2.4%) Mark Bailey (Green) 612 (2.0%) John Anderson (Independent) 398 (1.3%) Tim Lewis (Conservative) 395 (1.3%) *Elected in 2003 from East Antrim |
DUP 13,654 (45.5%, +10.9%) 3 seats UUP 6,574 (21.9%, -7.9%) 2 seats Alliance 4,738 (15.8%, +4.8%) 1 seat SDLP 1,769 (5.9%, -2.0%) SF 1,168 (3.9%, +1.4%) UKUP 731 (2.4%, +0.6%) Green 612 (2.0%, +1.5%) Anderson 398 (1.3%, +0.2%) Conservative 395 (1.3%, +0.7%) Electorate 56,666 Votes cast 30,293 (53.5%%); spoilt votes 254 (0.8%) Valid votes 30,039; quota 4,292 |
@Sammy Wilson (DUP) 15,766 (49.6% +13.6%)
* Roy Beggs (UUP) 8,462 (26.6% -9.8%)
@Sean Neeson (Alliance) 4,869 (15.3% +2.8%)
Daniel O'Connor (SDLP) 1,695 (5.3% -2.0%)
James McKeown (Sinn Fein) 828 (2.6% +0.1%)
David Kerr (Vote for Yourself Rainbow Dream Ticket) 147 (0.5%)
* outgoing MP
@ Member of the Assembly
The DUP's most widely expected gain. These votes, if cast in a six-seat STV election, would give the DUP three seats, the UUP two and Alliance one.
East Antrim is made up of all 15 wards in Larne; all 17 wards in Carrickfergus; 4 of the 25 wards in Newtownabbey (3 of the 7 wards in the University DEA [Jordanstown, Monkstown and Rosstulla], and 1 of the 6 wards in the Macedon DEA [Cloughfern])
Votes cast in 2005 were as follows:
DUP 12579.7 (40.0%)
UUP 7144.7 (22.7%)
Alliance 5279.7 (16.8%)
SDLP 1108.3 (3.5%)
Newtownabbey Ratepayers Association 581.4 (1.8%)
494.5 (1.6%)
UUC 420.6 (1.3%)
PUP 179.5 (0.6%)
Green 46 (0.1%)
Independents 3619 11.5%
Extrapolating from local government elections is tricky because the East Antrim constituency breaches the boundaries of two local electoral areas. However, these votes if cast in a six-seat STV election across the whole East Antrim constituency would be likely to give the DUP three seats, and the UUP and Alliance one each, with the last most likely to go to the UUP.
| *Roy
Beggs Jr (UUP) 5175 (16.7%) #Sammy Wilson (DUP) 4544 (14.7%) George Dawson (DUP) 3163 (10.2%) *David Hilditch (DUP) 2856 (9.2%) *Daniel O'Connor (SDLP) 2428 (7.8%) *Sean Neeson (Alliance) 2180 (7.0%) *Ken Robinson (UUP) 2062 (6.7%) Roy McCune (UUP) 1646 (5.3%) Jack McKee (Ind) 1449 (4.7%) Stewart Dickson (Alliance) 1192 (3.9%) *Roger Hutchinson (Ind) 1011 (3.3 %) Oliver McMullan (SF) 768 (2.5%) Tom Robinson (UKUP) 564 (1.8%) Carolyn Howarth (PUP) 534 (1.7%) Robert Mason (Ind) 364 (1.2%) John Anderson (Ind) 348 (1.1%) Anne Monaghan (NIWC) 307 (1.0%) Alan Greer (Cons) 196 (0.6%) Andrew Frew (Green) 165 (0.5%) |
DUP 10,563 (34.1%, +11.9%) 3
seats UUP 8,883 (28.7%, -0.9%) 2 seats Alliance 3,372 (10.9%, -9.2%) 1 seat Best result for Alliance in Northern Ireland Inds 3,172 (10.2%) SDLP 2,428 (7.8%, +1.9%) SF 768 (2.5%, +0.4%) UKUP 564 (1.8%, -6.2%) PUP 534 (1.7%, -2.3%) NIWC 307 (1.0%) Con 196 (0.6%, -0.1%) Green 165 (0.5%) Electorate 55,473 |
* Member of 1998-2003 Assembly for East Antrim
# Member of 1998-2003 Assembly for East Belfast
Reaction: The DUP's vote management got them three seats,
gaining from Roger Hutchinson and Daniel O'Connor, with the UUP
and Alliance incumbents holding on. The final margin of Dawson
over O'Connor was a substantial 796 votes, with Dawson's running
mate only 14 votes ahead of him; the gap between them had never
been as much as 300 votes. The UUP candidates had balanced even
better, with never more than 66 votes separating Robinson and
McCune, but the numbers weren't there and McCune was eventually
eliminated.
East Antrim had lost 10.57% of its electorate in the great electoral register shake-out, varying from 17.96% in the Northland ward of Carrickfergus to 5.27% in Boneybefore, also in Carrickfergus. 10 constituencies lost fewer voters, 7 lost more.
Electorate: 60,897; votes cast: 36,327 (59.6%); spoilt votes: 327
(0.9%)
Valid votes: 36,000; UUP majority 128
* outgoing MP
@ member of the Assembly
This result was a welcome relief to the UUP after several disappointing losses elsewhere, though the narrowness of the result was alarming. If this election had been for six seats to an Assembly, the DUP and UUP would each have won two, and Alliance one; the last seat would have been between a fifth Unionist and the SDLP.
Votes cast in 2001 were as follows:
DUP 10179.5 (29%)
UUP 9280.1 (27%)
Alliance 6219.5 (18%) Best equivalent result in Northern
Ireland
SDLP 1320 (4%)
PUP 945.9 (3%)
UUAP 555.9 (2%)
SF 554.3 (2%)
Community Candidates 218.2 (1%)
NIUP 216 (1%)
Newtownabbey Ratepayers Association 108.3 (1%)
Independents 5093.8 (14%)
These votes if cast in a six-seat STV election across the whole East Antrim constituency would have certainly have given the UUP and DUP two seats and Alliance one. The last seat could have gone to anyone.
| Roy Beggs Jr
(UUP) 5,764 *Sean Neeson (Alliance) 5,247 David Hilditch (DUP) 4,876 *Jack McKee (DUP) 3,013 Roger Hutchinson (UKUP) 2,866 *May Steele (UUP) 2,399 Ken Robinson (UUP) 2,384 Danny O'Connor (SDLP) 2,106 Stewart Dickson (Alliance) 1,921 James Brown (Unionist) 1,571 William Greer (PUP) 1,432 Chrissy McAuley (SF) 746 Tommy Kirkham (UDP) 596 Robert Lindsay Mason (Pro-Agreement Independent) 424 Terence Dick (C) 233 James Barr McKissock (NLP) 32 |
UUP 10,547
(29.62%) 2 seats DUP 7,889 (22.15%) 1 seat Alliance 7,168 (20.13%) 1 seat Best result for Alliance in Northern Ireland UKUP 2,866 (8.05%) 1 seat SDLP 2,106 (5.91%) 1 seat Unionist 1,571 (4.41%) PUP 1,432 (4.02%) SF 746 (2.09%) UDP 596 (1.67%) Pro-Agreement Ind 424 (1.19%) C 233 (0.65%) NLP 32 (0.09%) Electorate: 59,313 |
* elected in 1996 Forum/talks election from East Antrim
This was a major shock. On the first count it was clear that the UKUP had probably done well enough to take a seat, which in itself was surprising. But as transfers continued, the SDLP candidate, who had started eighth, overtook candidates from first the UUP and then the DUP to take the final place, in an area where he was the SDLP's only local councillor, by 4191 votes to McKee's 4152, a margin of 49 votes, the closest of the whole election.
UUP 6758 (28%)
DUP 4888.2 (20%)
Alliance 4510.5 (19%)
PUP 991.1 (4%)
SDLP 409 (2%)
Labour 274.7 (1%)
UDP 232.7 (1%)
UKUP 220.0 (1%)
Newtownabbey Ratepayers Association 176.4 (1%)
Northern Ireland Labour 65.5 (0.27%)
Others 5,591.3 (23%)
Total valid 24,117.5 (41% of electorate)
* outgoing MP
ƒ member of the Forum
Ulster Unionist Party (UUP) 10,036 (30%); May Steele, Thomas
Robinson elected
Democratic Unionist Party (DUP) 9,557 (29%); Jack McKee, May
Beattie elected
Alliance Party of Northern Ireland (APNI) 3,957 (12%); Sean Neeson
elected
Progressive Unionist Party (PUP) 2,254 (7%)
Social Democratic and Labour Party (SDLP) 2,213 (7%)
United Kingdom Unionist Party (UKU) 2,041 (6%)
Ulster Democratic Party (UDP) 1,141 (3%)
Sinn Féin (SF) 619 (2%)
Northern Ireland Women's Coalition (NIWC) 323 (1%)
Conservative Party (Con) 271 (1%)
Green Party 224 (1%)
Labour (Lab) 218 (1%)
Independent Democratic Unionist Party 107 (0.32%)
Democratic Partnership 102 (0.31%)
Ulster Independence Movement (UIM) 86 (0.26%)
Independent McMullan 81 (0.24%)
Workers Party (WP) 69 (0.21%)
Democratic Left (DL) 33 (0.10%)
Natural Law Party (NLP) 14 (0.04%)
Independent Chambers 5 (0.01%)
Electorate: 57,989; votes cast: 33,403 (57.6%); spoilt votes: 52 (0.1%); valid votes: 33,351
McKee and Neeson had both been elected to the 1982 Assembly for North Antrim.
| DUP | UKUP | UUP | PUP | Oth U | Alliance | Oth | SDLP | SF | |
| 2007a |
45% | 2% | 22% | 1% | 16% | 3% | 6% | 4% | |
| 2005w | 50% | 27% | 15% | 0% | 5% | 3% | |||
| 2005lg | 40% | 23% | 1% | 1% | 17% | 14% | 4% | 2% | |
| 2003a | 34% | 2% | 29% | 2% | 9% | 11% | 4% | 8% | 2% |
| 2001w | 36% | 36% | 2% | 12% | 3% | 7% | 3% | ||
| 2001lg | 29% | 27% | 3% | 2% | 18% | 16% | 4% | 2% | |
| 1998a | 22% | 8% | 30% | 4% | 7% | 20% | 1% | 6% | 2% |
| 1997lg | 20% | 1% | 28% | 4% | 1% | 19% | 25% | 2% | |
| 1997w | 19% | 39% | 5% | 7% | 20% | 3% | 5% | 2% | |
| 1996f | 29% | 6% | 30% | 7% | 5% | 12% | 3% | 7% | 2% |
See also: Full 2003 results from East Antrim | Full 1998 results from East Antrim | The Boundary Commission's Provisional Recommendations | Boundary Commission 2003 | Jim Riley's analysis of votes and seats in the 1998 Assembly election | The constituencies
Other sites based at ARK: ORB (Online Research Bank) | CAIN (Conflict Archive on the INternet) | Northern Ireland Life and Times Survey
Your comments, please! Send an email to me at nicholas.whyte@gmail.com.
 |
This page has been developed with the support of a project grant from the New Initiatives Fund of the Electoral Commission. However, any views expressed on this page or, in particular, other pages of this website are those of the author and not necessarily shared by The Electoral Commission. |
Nicholas Whyte, 3 June 1998; last updated 7 May 2022 by Conal Kelly.
|
|
Disclaimer:� Nicholas Whyte 1998-2015
|