
 |
 |
|
|
|
|


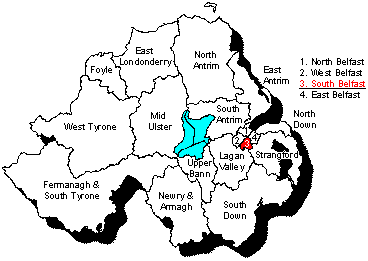
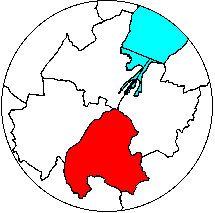
Maps by Conal Kelly and Nicholas Whyte
See
also results
of all South Belfast elections 1993-2010
and full
counts from 1998 and 2007.
Spreadsheet for 2003 here.
| |
|
|
Surplus McGimpsey |
Exclude Steven |
Exclude Lynn |
Exclude Barbour & Lomas |
||||
| Michael McGimpsey | UUP | 5389 | -913 | 4476 | - | 4476 | - | 4476 | - | 4476 |
| Mark Robinson | DUP | 3991 | 33.32 | 4024.32 | 0 | 4024.32 | 1 | 4025.32 | 14.34 | 4039.66 |
| Esmond Birnie | UUP | 2311 | 551.99 | 2862.99 | 0 | 2862.99 | 3 | 2865.99 | 56.19 | 2922.18 |
| Carmel Hanna | SDLP | 3910 | 12.92 | 3922.92 | 3 | 3925.92 | 10 | 3935.92 | 17.17 | 3953.09 |
| Alex Maskey | SF | 3933 | 2.55 | 3935.55 | 2 | 3937.55 | 10 | 3947.55 | 21 | 3968.55 |
| Alasdair McDonnell | SDLP | 3266 | 17 | 3283 | 4 | 3287 | 20 | 3307 | 10.34 | 3317.34 |
| Monica McWilliams | NIWC | 2150 | 30.43 | 2180.43 | 5 | 2185.43 | 18 | 2203.43 | 45 | 2248.43 |
| Ruth Patterson | DUP | 2538 | 18.7 | 2556.7 | 0 | 2556.7 | 0 | 2556.7 | 19.34 | 2576.04 |
| Geraldine Rice | Alliance | 1185 | 13.94 | 1198.94 | 3 | 1201.94 | 1 | 1202.94 | 12 | 1214.94 |
| John Hiddleston | UUP | 769 | 199.75 | 968.75 | 1 | 969.75 | 1.17 | 970.92 | 19.68 | 990.6 |
| Tom Ekin | Alliance | 664 | 8.5 | 672.5 | 1 | 673.5 | 5 | 678.5 | 19.68 | 698.18 |
| Thomas Morrow | PUP | 495 | 14.62 | 509.62 | 0 | 509.62 | 2 | 511.62 | 9 | 520.62 |
| John Wright | Green | 308 | 1.19 | 309.19 | 16.17 | 325.36 | 5 | 330.36 | 37.17 | 367.53 |
| Roger Lomas | Cons | 116 | 3.06 | 119.06 | 1 | 120.06 | 0 | 120.06 | -120.06 | 0 |
| James Barbour | Soc | 167 | 1.19 | 168.19 | 2 | 170.19 | 11 | 181.19 | -181.19 | 0 |
| Patrick Lynn | WP | 96 | 0.17 | 96.17 | 1 | 97.17 | -97.17 | 0 | - | - |
| Lindsay Steven | VFYP | 42 | 0.17 | 42.17 | -42.17 | 0 | - | - | - | - |
| 3.5 | 3.5 | 3 | 6.5 | 10 | 16.5 | 20.34 | 36.84 | |||
Stage
2:
Of McGimpsey's 5389 votes, 3247 transferred to Birnie and
1175
to Hiddleston, thus 4422 (82.1%) to the other UUP candidates;
196 went
to Robinson and 110 to Patterson, thus 306 (5.7%) to the DUP;
179
(3.3%) went to McWilliams (NIWC); 100 went to McDonnell and 76
to
Hanna, thus 176 (3.3%) to the SDLP; 82 went to Rice and 50 to
Ekin,
thus 132 (2.4%) to Alliance; 86 (1.6%) to Morrow (PUP); 18
(0.3%) to
Lomas (Cons); 15 (0.3%) to Maskey (SF); 7 (0.1%) to Wright
(Green);
also 7 (0.1%) to Barbour (Socialist); 1 (0.02%) to Lynn (WP);
and also
1 (0.02%) to Steven (VFYP) with 39 (0.7%) non-transferable.
| |
|
|
Exclude Wright |
Exclude Morrow |
Exclude Ekin |
Exclude Hiddleston |
||||
| Michael McGimpsey | UUP | 4476 | - | 4476 | - | 4476 | - | 4476 | - | 4476 |
| Mark Robinson | DUP | 4039.66 | 9.17 | 4048.83 | 102.04 | 4150.87 | 4.34 | 4155.21 | 91.61 | 4246.82 |
| Esmond Birnie | UUP | 2922.18 | 16.51 | 2938.69 | 99.4 | 3038.09 | 50.02 | 3088.11 | 783.2 | 3871.31 |
| Carmel Hanna | SDLP | 3953.09 | 29.17 | 3982.26 | 8.51 | 3990.77 | 65.53 | 4056.3 | 6.38 | 4062.68 |
| Alex Maskey | SF | 3968.55 | 19 | 3987.55 | 2 | 3989.55 | 2 | 3991.55 | 0 | 3991.55 |
| Alasdair McDonnell | SDLP | 3317.34 | 23 | 3340.34 | 10.17 | 3350.51 | 30.51 | 3381.02 | 8.53 | 3389.55 |
| Monica McWilliams | NIWC | 2248.43 | 139.17 | 2387.6 | 43.53 | 2431.13 | 86.87 | 2518 | 24.23 | 2542.23 |
| Ruth Patterson | DUP | 2576.04 | 4 | 2580.04 | 100.21 | 2680.25 | 3.17 | 2683.42 | 135.25 | 2818.67 |
| Geraldine Rice | Alliance | 1214.94 | 55 | 1269.94 | 14.68 | 1284.62 | 462.72 | 1747.34 | 15.38 | 1762.72 |
| John Hiddleston | UUP | 990.6 | 5 | 995.6 | 94.21 | 1089.81 | 21.19 | 1111 | -1111 | 0 |
| Tom Ekin | Alliance | 698.18 | 28.17 | 726.35 | 13.51 | 739.86 | -739.86 | 0 | - | - |
| Thomas Morrow | PUP | 520.62 | 8 | 528.62 | -528.62 | 0 | - | - | - | - |
| John Wright | Green | 367.53 | -367.53 | 0 | - | - | - | - | - | - |
| |
|
36.84 | 31.34 | 68.18 | 40.36 | 108.54 | 13.51 | 122.05 | 46.42 | 168.47 |
| |
|
|
Exclude Rice |
Exclude Patterson |
Surplus Robinson |
|||
| Michael McGimpsey | UUP | 4476 | - | 4476 | - | 4476 | - | 4476 |
| Mark Robinson | DUP | 4246.82 | 21.34 | 4268.16 | 2393 | 6661.16 | -2185.16 | 4476 |
| Esmond Birnie | UUP | 3871.31 | 441.18 | 4312.49 | 224 | 4536.49 | - | 4536.49 |
| Carmel Hanna | SDLP | 4062.68 | 270.02 | 4332.7 | 4.85 | 4337.55 | 67 | 4404.55 |
| Alex Maskey | SF | 3991.55 | 12 | 4003.55 | 8 | 4011.55 | 1 | 4012.55 |
| Alasdair McDonnell | SDLP | 3389.55 | 199.55 | 3589.1 | 10.87 | 3599.97 | 50 | 3649.97 |
| Monica McWilliams | NIWC | 2542.23 | 626.25 | 3168.48 | 40.06 | 3208.54 | 314 | 3522.54 |
| Ruth Patterson | DUP | 2818.67 | 20.17 | 2838.84 | -2838.84 | 0 | - | - |
| Geraldine Rice | Alliance | 1762.72 | -1762.72 | 0 | - | - | - | - |
| |
|
168.47 | 172.21 | 340.68 | 158.06 | 498.74 | 1753.16 | 2251.9 |
Stage 12: Of the 2393 votes transferred from Patterson to Robinson, 314 (13.1%) went to McWilliams (NIWC); 67 went to Hanna and 50 to McDonnell, thus 117 (4.9%) to the SDLP; and 1 (0.04%) to Maskey (SF) with 1961 (81.9%) non-transferable.
See also: Jim Riley's analysis of votes and seats in the 1998 Assembly election | The constituencies | Single Transferable Vote | The political parties | Useful books and links
Full 2003 results for each seat: East Belfast | North Belfast | South Belfast | West Belfast | East Antrim | North Antrim | South Antrim | North Down | South Down | Fermanagh and South Tyrone | Foyle | Lagan Valley | East Londonderry | Mid Ulster | Newry and Armagh | Strangford | West Tyrone | Upper Bann
Other sites based at ARK: ORB (Online Research Bank) | CAIN (Conflict Archive on the INternet) | Northern Ireland Life and Times Survey
Your comments, please! Send an email to me at nicholas.whyte@gmail.com..
Compiled by Nicholas Whyte, Becky Vanasek and Simon Smyth, 10 April 2004.
|
Disclaimer:© Nicholas Whyte 1998-2004 Last
Updated on
Sunday, 21-Mar-2010
10:44
|