

| |
|
|
|
|
|
|
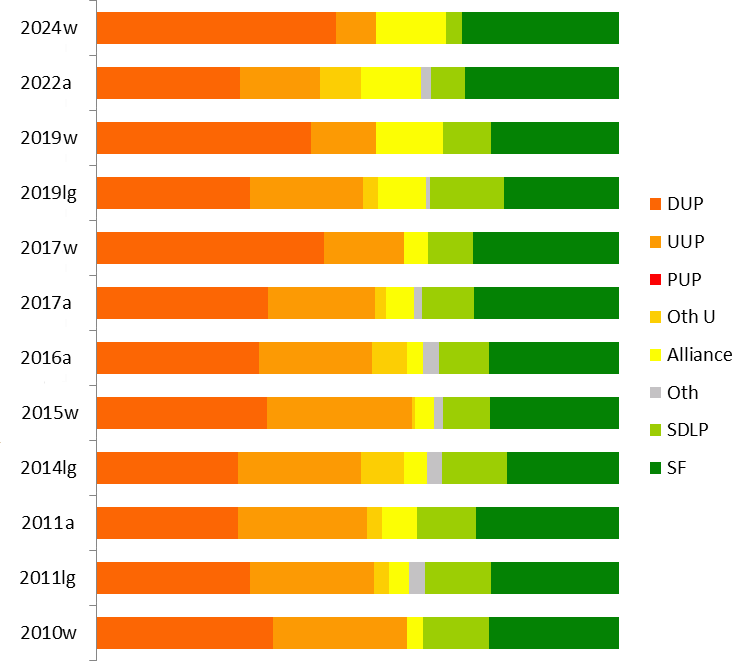 |
| Map and graph by Conal Kelly | |
This constituency contains the central chunk of Armagh,
Banbridge and Craigavon District Council. The MP is Carla
Lockhart of the DUP, first elected in 2019. She replaced party
colleague David Simpson who retired. Simpson had defeated David
Trimble (then the UUP leader, now Lord Trimble of Lisnagarvey) in
2005. Trimble had won the 1990 by-election caused by the death of
his party's deputy leader, Harold McCusker. The DUP hold two
Assembly seats here, with SF, the UUP, and Alliance on one each.
See the
1983-92 Upper Bann results.
In the new revisions, Upper Bann loses Loughbrickland to South
Down and its eastern fringes to Lagan Valley, but gains parts of
the apple country of North Armagh. It was the most bloated
constituency on the old boundaries. The result looks big on the
map but has little net electoral impact.
2024 Westminster result
Carla Lockhart (DUP) 21,642 (45.7%, +4.9%)
Catherine Nelson (SF) 14,236 (30.1%, +5.4%)
Eoin Tennyson (Alliance) 6,322 (13.4%, +0.7%)
Kate Evans (UUP) 3,662 (7.7%, -4.7%)
Malachy Quinn (SDLP) 1,496 (3.2%, -6.2%)
47,595 total votes (58.6%), 47,358 valid, 237 invalid (0.5%)
Consolidation for the top two candidates doing a tactical squeeze
on those lower down.
In a five-seat STV election, the DUP and SF should both win two,
and Alliance one.
2019 Westminster notional result on new boundaries:
DUP 18,931 (40.8%)
SF 11,454 (24.7%)
Alliance 5,880 (12.7%)
UUP 5,788 (12.5%)
SDLP 4,351 (9.4%)
Aontu 38 (0.1%)
| DUP | UUP | Alliance | SDLP | SF | Aontu | ||
| 2019 actual |
20,501 | 6,197 | 6,433 | 4,623 | 12,291 | ||
| 41.0% | 12.4% | 12.9% | 9.2% | 24.6% | |||
| From Upper Bann |
To Upper Bann |
18,109 | 5,474 | 5,711 | 4,130 | 10,980 | |
| From Upper Bann | To Lagan Valley |
-1,818 | -550 | -571 | -410 | -1090 | |
| From Upper Bann | To South Down |
-574 | -174 | -152 | -83 | -221 | |
| From Newry and Armagh |
To Upper Bann | 822 | 314 | 169 | 221 | 474 | 38 |
| 2019 notional |
18,931 | 5,788 | 5,880 | 4,351 | 11,454 | 38 | |
| 40.8% | 12.5% | 12.7% | 9.4% | 24.7% | 0.1% | ||
| -0.2% | 0.1% | -0.2% | 0.1% | 0.1% | 0.1% |
|
|
|
|
|
|
|
|
|
| 2024w | 45.7% |
7.7% |
|
13.4% |
|
3.2% |
30.1% |
| 2022a |
|
|
|
|
|
|
|
| 2019w |
|
|
|
|
|
||
| 2019lg |
|
|
|
|
|
|
|
| 2017w |
|
|
|
|
|
||
| 2017a |
|
|
|
|
1.5% |
|
|
| 2016a |
|
|
|
|
3.2% |
|
|
| 2015w |
|
|
|
|
1.7% |
|
|
| 2014lg |
|
|
|
|
|
|
|
| 2011a |
|
|
|
|
|
|
|
| 2011lg |
|
|
|
|
|
|
|
| 2010w | 33.8% | 25.7% | 3.0% | 12.7% | 24.7% | ||
| 2007a |
|
|
|
|
|
|
|
| 2005w |
|
|
|
|
|
|
|
| 2005lg |
|
|
|
|
|
|
| @John O'Dowd (SF) 9,242
(16.5%) @Jonathan Buckley (DUP) 8,869 (15.8%) Liam Mackle (SF) 7,260 (12.9%) @Diane Dodds (DUP) 6,548 (11.7%) Eóin Tennyson (Alliance) 6,440 (11.5%) @Doug Beattie (UUP) 5,199 (9.3%) Darrin Foster (TUV) 4,373 (7.8%) @Dolores Kelly (SDLP) 3,645 (6.5%) Glenn Barr (UUP) 3,367 (6.0%) Aidan Gribbin (Aontú) 571 (1.0%) Lauren Kendall (Green) 459 (0.8%) Glenn Beattie (Heritage) 128 (0.2%) @ member of the Assembly when it was dissolved. |
SF 16,502 (29.4%, +1.6%)
1 seat DUP 15,417 (27.5%, -5.3%) 2 seats UUP 8,566 (15.3%, -5.3%) 1 seat Alliance 6,440 (11.5%, +6.2%) 1 seat TUV 4,373 (7.8%, +5.8%) SDLP 3,645 (6.5%, -3.4%) (-1) Aontú 571 (1.0%) Green 459 (0.8%, -0.3%) Heritage 128 (0.2%) Electorate: 91,149 Votes cast: 56,954 (62.5%, ±0%), spoilt votes 853 (1.5%) Valid votes: 56,101, quota 9,351 |
@Carla Lockhart (DUP) 20,501 (41.0%, -2.6%)
@John O'Dowd (SF) 12,291 (24.6%, -3.4%)
Eóin Tennyson (Alliance) 6,433 (12.9%, +8.3%)
@Doug Beattie (UUP) 6,197 (12.4%, -3.0%)
@Dolores Kelly (SDLP) 4,623 (9.2%, +0.7%)
@ member of the Assembly.
Electorate: 82,887; Total Poll: 50,348 (60.7%); Invalid Votes:
303 (0.6%); Valid Votes: 50,045
Carla Lockhart successfully defended the seat previously held by
David Campbell. This was the UUP's biggest drop in vote share
across Northern Ireland. In a five-seat Assembly election, these
votes would give the DUP two seats and SF one. The winners of last
two seats would likely be SF and the DUP.
From the 2011 census, Upper Bann includes:
The entire Armagh, Banbridge and Craigavon DEA of Craigavon
* outgoing MP.
@ member of the Assembly.
Electorate: 80,168; Votes Polled: 51,431 (64.2%); Invalid Votes:
173 (0.3%); Valid Votes: 51,258
Another strong result for the DUP. If cast in a five-seat Assembly
election, these votes would give the DUP and SF two MLAs each, and
the UUP one.
| @Carla Lockhart (DUP)
9,140 (17.7%) @John O'Dowd (SF) 8,220 (15.9%) Jonathan Buckley (DUP) 7,745 (15.0%) Nuala Toman (SF) 6,108 (11.8%) @Doug Beattie (UUP) 5,467 (10.6%) @Jo-Anne Dobson (UUP) 5,132 (10.0%) Dolores Kelly (SDLP) 5,127 (9.9%) Tara Doyle (Alliance) 2,720 (5.3%) Roy Ferguson (TUV) 1,035 (2.0%) Simon Lee (Green) 555 (1.1%) Colin Craig (WP) 218 (0.4%) Ian Nickels (Con) 81 (0.2%) @ member of the Assembly when it was dissolved. |
DUP 16,885 (32.8%,
+1.7%) 2 seats SF 14,328 (27.8%, +2.9%) 1 seat (-1) UUP 10,599 (20.6%, -1.0%) 1 seat (-1) SDLP 5,127 (9.9%, +0.4%) 1 seat (+1) Alliance 2,720 (5.3%, +2.2%) TUV 1,035 (2.0%, -0.6%) Green 555 (1.1%, 0.0%) WP 218 (0.4%) Con 81 (0.2%, 0.0%) Electorate: 83,431 Votes cast: 52,174 (62.5%, +8.1%), spoilt votes 626 (1.2%) Valid votes: 51,548, quota 8,592 |
| Carla Lockhart (DUP) 7,993
(17.5%) @Sydney Anderson (DUP) 6,195 (13.6%) Catherine Seeley (Sinn Féin) 6,164 (13.5%) @John O'Dowd (Sinn Féin) 5,209 (11.4%) @Jo-Anne Dobson (UUP) 5,155 (11.3%) @Dolores Kelly (SDLP) 4,335 (9.5%) Doug Beattie (UUP) 2,969 (6.5%) Kyle Savage (UUP) 1,760 (3.9%) Harry Hamilton (Alliance) 1,424 (3.1%) Roy Ferguson (TUV) 1,177 (2.6%) David Jones (UKIP) 1,072 (2.3%) Martin Kelly (CISTA) 672 (1.5%) Sophie Long (PUP) 704 (1.5%) Simon Lee (Green) 495 (1.1%) Emma Hutchinson (NI Labour) 250 (0.5%) Ian Nickels (Conservatives) 79 (0.2%) Steven McCarroll (Independent) 33 (0.1%)) @ member of the Assembly when it was dissolved. |
DUP 14,188 (31.1%, +4.0%)
2 seats Sinn Féin 11,373 (24.9%, -2.3%) 2 seats (+1) UUP 9,884 (21.6%, -3.0%) 2 seats SDLP 4,335 (9.5%, -1.9%) (-1) Alliance 1,424 (3.1%, -3.4%) TUV 1,177 (2.6%, +0.2%) UKIP 1,072 (2.3%, +1.7%) PUP 704 (1.5%) CISTA 672 (1.5%) Green 495 (1.1%) NI Labour 250 (0.5%) Conservatives 79 (0.2%) Independent 33 (0.1%)) Electorate: 85,204 Votes cast: 46,383 (54.4%); spoilt 697 (1.5%) Valid votes: 45,686; quota 6,527 |
*David Simpson (DUP) 15,430 (32.7%, -1.2%)
Jo-Anne Dobson (UUP) 13,166 (27.9%, +2.2%)
Catherine Seeley (SF) 11,593 (24.6%, -0.2%)
Dolores Kelly (SDLP) 4,238 (9.0%, -3.8%)
Peter Lavery (Alliance) 1,780 (3.8%, +0.8%)
Martin Kelly (Cannabis Is Safer Than Alcohol) 460 (1.0%)
Damien Harte (WP) 351 (0.7%)
Amandeep Bhogal (Conservative) 201 (0.4%)
Electorate: 80,060; Votes Polled: 47,480 (59.3%); Invalid Votes:
254 (0.5%); Valid Votes: 47,219
A solid defence by Simpson, though the UUP are now breathing down
his neck. SF's heralded breakthrough did not happen.
If cast in an Assembhly election, these votes would give two
seats each to the DUP, UUP and SF.
From the 2011 census, Upper Bann includes:
The entire Armagh, Banbridge and Craigavon DEA of Craigavon
| @John O'Dowd (SF) 6,649 (15.7%) @Sydney Anderson (DUP) 5,854 (13.8%) @Stephen Moutray (DUP) 5,645 (13.3%) Johnny McGibbon (SF) 4,879 (11.5%) @Dolores Kelly (SDLP) 4,846 (11.4%) @Sam Gardiner (UUP) 3,676 (8.7%) Colin McCusker (UUP) 3,402 (8.0%) Joanne Dobson (UUP) 3,348 (7.9%) Harry Hamilton (Alliance) 1,979 (4.7%) David Vance (TUV) 1,026 (2.4%) Sheila McQuaid (Alliance) 786 (1.9%) Barbara Trotter (UKIP) 272 (0.6%) @ member of the Assembly when it was dissolved. |
SF 11,528 (27.2%, +1.9%)
1 seat DUP 11,499 (27.1%, -4.3%) 2 seats UUP 10,426 (24.6%, +3.4%) 2 seats SDLP 4,846 (11.4%, -1.3%) 1 seat Alliance 2,765 (6.5%, +4.7%) TUV 1,026 (2.4%) UKIP 272 (0.6%) Electorate: 77,905 Votes cast: 43,113 (55.3%); spoilt 751 (1.7%) Valid votes: 42,362; quota 6,052 |
SF were talking up their chances of a
gain here, and on the first preferences, where they got more than
any other party, I thought that they had indeed taken the SDLP
seat. But in fact Kelly survived by 340 votes ahead of McGibbon,
benefiting from Alliance transfers and SF's traditional failure to
balance here. Note also Joanne Dobson managing to win a seat from
8th place, the UUP managing their votes unusually well.
Candidates:
*@David Simpson (DUP) 14,000 (33.8%, -3.8%)
Harry Hamilton (UCUNF) 10,639 (25.7%, +0.2%)
@John O'Dowd (Sinn Féin) 10,237 (24.7%, +3.7%)
Dolores Kelly (SDLP) 5,276 (12.7%, -0.2%)
Brendan Heading (Alliance) 1,231 (3.0%, +0.8%)
Electorate: 74,732; Total Poll: 41,681 (55.8%); Invalid Votes: 298
(0.7%); Valid Votes: 41,383
* incumbent
@ elected to the Northern Ireland Assembly from this constituency
One of the seats where the Ulster Unionist-Conservative alliance needed to make significant progress, and failed to do so. Meanwhile the Natiobnalist vote creeps closer to three quotas, though on these figures, there would probably be no change in the districubtion of seats at an Assembly election (2 each for DUP and UUP, 1 each for SF and SDLP).
| *John O'Dowd (SF) 7733
(18.0%) *David Simpson MP (DUP) 6828 (15.9%) *Samuel Gardiner (UUP) 5135 (12.0%) *Dolores Kelly (SDLP) 4689 (10.9%) *Stephen Moutray (DUP) 3663 (8.5%) Desmond Ward (SF) 3118 (7.3%) Junior McCrum (DUP) 2975 (6.9%) George Savage (UUP) 2167 (5.1%) George Hatch (UUP) 1815 (4.2%) David Calvert (Independent Unionist) 1332 (3.1%) Helen Corry (Green) 1156 (2.7%) Sheila McQuaid (Alliance) 798 (1.9%) Patrick McAleenan (SDLP) 761 (1.8%) Barry Toman (RSF) 386 (0.9%) David Fry (Conservative) 248 (0.6%) Suzanne Peeples (Independent Unionist) 78 (0.2%) *Elected in 2003 from Upper Bann |
DUP 13,466 (31.4%, +2.9%) 2 seats SF 10,851 (25.3%, +3.5%) 1 seat UUP 9,117 (21.3%) 2 seats SDLP 5,450 (12.7%) 1 seat Ind U's 1,410 (3.3%) Green 1,156 (2.7%) Alliance 798 (1.9%, +0.5%) RSF 386 (0.9%) Conservative 248 (0.6%) Electorate 70,716 Votes cast 43,235 (61.1%); spoilt votes 353 (0.8%) Valid votes 42,882; quota 6,127 |
@David Simpson (DUP) 16,679 (37.6% +8.1%)
*@David Trimble (UUP) 11,281 (25.5% -8.0%)
@John O'Dowd (Sinn Fein) 9,305 (21.0% -0.1%)
@Dolores Kelly (SDLP) 5,747 (13.0% -1.9%)
Alan Castle (Alliance) 955 (2.2%)
Tom French (WP) 355 (0.8% -0.2%)
* outgoing MP.
@ Member of the Assembly
Trimble's loss was the most dramatic result of the election. These votes, if cast in a six-seat STV election, would probably give the DUP and UUP two seats each, with one each for SF and the SDLP.
The constituency comprises all 26 wards in Craigavon and 9 of the 17 wards in Banbridge (all 6 wards in the Banbridge Town DEA, and 3 of the 6 wards in the Knockiveagh DEA [Gilford, Lawrencetown and Loughbrickland]).
DUP 13,774.5 (31.3%)
UUP 11,191.5 (25.4%)
Sinn Fein 8,111 (18.4%)
SDLP 7,610.5 (17.3%)
Independent 1,708 (3.9%)
Alliance 1,520 (3.4%)
WP 155 (0.4%)
These votes, if cast in a six-seat STV election, would probably give the DUP and UUP two seats each, with one each for SF and the SDLP.
| *David Trimble
MP (UUP) 9158 (21.1%) David Simpson (DUP) 5933 (13.6%) John O'Dowd (SF) 5524 (12.7%) Stephen Moutray (DUP) 4697 (10.8%) *Dara O'Hagan (SF) 3970 (9.1%) Dolores Kelly (SDLP) 3661 (8.4%) Kieran Corr (SDLP) 3157 (7.3%) Samuel Gardiner (UUP) 2359 (5.4%) *Denis Watson (DUP) 1770 (4.1%) *George Savage (UUP) 1269 (2.9%) David Jones (Ind) 585 (1.3%) Sidney Anderson (Ind) 581 (1.3%) Frank McQuaid (Alliance) 571 (1.3%) Tom French (WP) 247 (0.6%) |
UUP 12,786 (29.4%, +0.5%) 2
seats DUP 12,400 (28.5%, +13.0%) 2 seats SF 9,494 (21.8%, +7.5%) 1 seat SDLP 6,818 (15.7%, -8.0%) 1 seat Inds 1,166 (2.7%) Alliance 571 (1.3%, -1.8%) WP 247 (0.6%, +0.1) Electorate 68,814 |
Reaction: The DUP gained Watson's seat, though he himself failed to be elected as a DUP candidate; better balancing would have made no difference. Likewise SF and UUP members of the last Assembly were pushed out by running-mates. The final margin was over 1600, between SF's O'Dowd and O'Hagan.
Upper Bann had lost 9.10% of its electorate in the great electoral register shake-out, varying from 14.74% in the Drumgor ward of Craigavon to 5.56% in The Birches, also in Craigavon. 4 constituencies lost fewer voters, 13 lost more.Electorate: 72,574; votes cast: 51,376 (70.7%); spoilt votes: 339
(0.6%)
Valid votes: 51,037; UUP majority 2,058
* outgoing MP
@ Member of the Assembly
The DUP were cock-a-hoop at the challenge they managed to mount against Trimble in his own constituency, but even more interesting was the reversal of votes between the SDLP and Sinn Fein. A six-seat Assembly election on these figures would give the Unionist parties two seats each, and the Nationalists one each.
UUP 15201.5 (30%)
DUP 11352.5 (23%)
SDLP 10026.5 (20%)
SF 8833.5 (18%)
Alliance 1065 (2%)
UKUP 990.5 (2%)
WP 132 (0.3%)
Independents 2790 (6%)
Total valid 50391.5
Extrapolating from the local government elections is difficult because the Upper Bann constituency breaches a local electoral area boundary. If we make some reasonable adjustments, we get these figures for the whole Upper Bann constituency. This would give the UUP two safe seats, and the DUP, SDLP and SF one each. The last seat would be most likely to go to the DUP, but an independent Unionist could not be excluded.
| *David Trimble MP (UUP) 12,338 *Brid Rodgers (SDLP) 9,260 Denis Watson (UUU) 4,855 Dara O'Hagan (SF) 4,301 *Mervyn Carrick (DUP) 4,177 Ruth Allen (DUP) 3,635 Francie Murray (SF) 2,915 Mel Byrne (SDLP) 2,687 Frank McQuaid (All) 1,556 David Vance (UKU) 1,405 *Sam Gardiner (UUP) 1,097 George Savage (UUP) 669 Mark Neale (UUP) 455 Alan Evans (Lab) 439 Tom French (WP) 270 Kenny McClinton (Uster Independence) 207 Brian Silcock (Ind) 101 Jack Lyons (NLP) 32 |
UUP 14,559 (28.9%) 2 seats
SDLP 11,947 (23.7%) 1 seat DUP 7,812 (15.5%) 1 seat SF 7,216 (14.3%) 1 seat UUU 4,855 (9.6%) 1 seat Alliance 1,556 (3.1%) UKU 1,405 (2.8%) Lab 439 (0.9%) WP 270 (0.5%) UI 207 (0.4%) Ind 101 (0.2%) NLP 32 (0.1%) Electorate: 70,852 |
* elected in 1996 Forum/talks election from Upper Bann
Denis Watson succeeded in breaking through here as a dissident Unionist candidate. There were not quite enough votes for three Nationalist seats; if there had been, the loser would have been David Trimble's running-mate George Savage, leaving the party leader holding his party's only seat in his own constituency. As it was, Savage finished with 6,527 votes, well ahead of Mel Byrne's 5,878, especially with Denis Watson's surplus of 590 undistributed.
Ulster Unionist Party (UUP) 16,592 (36%) 2 seats (David Trimble
MP, Samuel Gardiner elected)
Social Democratic and Labour Party (SDLP) 9,846 (22%) 1 seat (Brid
Rodgers elected)
Democratic Unionist Party (DUP) 7,134 (16%) 1 seat (Mervyn Carrick
elected)
Sinn Féin (SF) 5,620 (12%) 1 seat (Michelle O'Connor elected)
Alliance Party of Northern Ireland (APNI) 2,152 (5%)
Progressive Unionist Party (PUP) 1,404 (3%)
United Kingdom Unionist Party (UKUP) 886 (2%)
Labour (Lab) 512 (1%)
Ulster Democratic Party (UDP) 402 (1%)
Northern Ireland Women's Coalition (NIWC) 390 (1%)
Workers Party (WP) 311 (1%)
Ulster Independence Movement (UIM) 180 (0.39%)
Green Party 178 (0.39%)
Democratic Partnership 71 (0.16%)
Democratic Left (DL) 36 (0.08%)
Natural Law Party (NLP) 14 (0.03%)
Independent Chambers 4 (0.01%)
Electorate: 69,928; votes cast: 45,781 (65.4%); spoilt votes: 49 (0.1%); valid votes: 45,732
Trimble had been elected to the 1975 Constitutional Convention, from South Belfast.
|
|
|
|
|
|
|
|
|
| 2007a |
|
|
|
|
|
|
|
| 2005w |
|
|
|
|
|
|
|
| 2005lg |
|
|
|
|
|
|
|
| 2003a |
|
|
|
|
|
||
| 2001w |
|
|
|
|
|
|
|
| 2001lg |
|
|
|
|
|
|
|
| 1998a |
|
|
|
|
|
|
|
| 1997lg |
|
|
|
|
|
|
|
| 1997w |
|
|
|
|
|
|
|
| 1996f |
|
|
|
|
|
|
|
See also: Full 2003 results from Upper Bann | Full 1998 results from Upper Bann | The Boundary Commission's Provisional Recommendations | Boundary Commission 2003 | Jim Riley's analysis of votes and seats in the 1998 Assembly election | The constituencies
Other sites based at ARK: ORB (Online Research Bank) | CAIN (Conflict Archive on the INternet) | Northern Ireland Life and Times Survey
Your comments, please! Send an email to me at nicholas.whyte@gmail.com.
 |
This page has been developed with the support of a project grant from the New Initiatives Fund of the Electoral Commission. However, any views expressed on this page or, in particular, other pages of this website are those of the author and not necessarily shared by The Electoral Commission. |
Nicholas Whyte, 3 June 1998; last updated 7 May 2022 by Conal Kelly.
|
Disclaimer:� Nicholas Whyte 1998-2015
|