

|
|
|
|
|
|
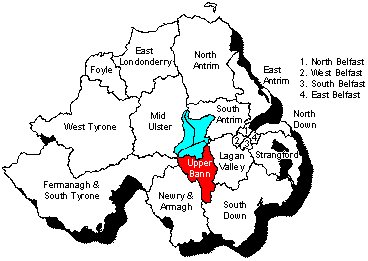
Map by Conal Kelly
See also results of all Upper Bann elections 1993-2010 and full counts from 2003 and 2007. Spreadsheet for 1998 here.
| |
Stage 1 | Surplus Trimble | Surplus Rodgers | Exclude Silcock, Lyons | ||||
| David Trimble | UUP | 12338 | -5138 | 7200 | |
7200 | |
7200 |
| Brid Rodgers | SDLP | 9260 | |
9260 | -2060 | 7200 | |
7200 |
| Dara O'Hagan | SF | 4301 | 5.46 | 4306.46 | 271.70 | 4578.16 | 6.10 | 4584.26 |
| Mervyn Carrick | DUP | 4177 | 133.14 | 4310.14 | 0.66 | 4310.80 | 4.42 | 4315.22 |
| Denis Watson | Ind U | 4855 | 510.30 | 5365.30 | |
5365.30 | 13.56 | 5378.86 |
| George Savage | UUP | 669 | 1711.92 | 2380.92 | 2.20 | 2383.12 | 20.34 | 2403.46 |
| Mel Byrne | SDLP | 2687 | 44.52 | 2731.52 | 1435.06 | 4166.58 | 18.62 | 4185.2 |
| Ruth Allen | DUP | 3635 | 101.64 | 3736.64 | 1.98 | 3738.62 | 6.42 | 3745.04 |
| Samuel Gardiner | UUP | 1097 | 1352.40 | 2449.40 | 1.76 | 2451.16 | 19.78 | 2470.94 |
| Francie Murray | SF | 2915 | 4.20 | 2919.20 | 97.68 | 3016.88 | 4.64 | 3021.52 |
| Frank McQuaid | APNI | 1556 | 239.40 | 1795.40 | 69.74 | 1865.14 | 33.28 | 1898.42 |
| David Vance | UKUP | 1405 | 105.00 | 1510.00 | |
1510.00 | 4.68 | 1514.68 |
| Mark Neale | UUP | 455 | 795.48 | 1250.48 | 1.76 | 1252.24 | 8.78 | 1261.02 |
| Alan Evans | Labour | 439 | 30.66 | 469.66 | 36.30 | 505.96 | 16.40 | 522.36 |
| Tom French | WP | 270 | 26.04 | 296.04 | 78.10 | 374.14 | 9.50 | 383.64 |
| Kenny McClinton | Ind U | 207 | 13.02 | 220.02 | 0.44 | 220.46 | 3.84 | 224.3 |
| Brian Silcock | Ind | 101 | 41.58 | 142.58 | 3.52 | 146.10 | -146.10 | |
| Jack Lyons | NLP | 32 | 2.94 | 34.94 | 3.74 | 38.68 | -38.68 | |
| |
|
|
|
|
|
|
|
|
| non-transferable | |
|
20.30 | 20.30 | 55.36 | 75.66 | 14.42 | 90.08 |
Stage 2: Of Trimble's 12338 votes, 4076 went to Savage, 3220 to Gardiner and 1894 to Neale, thus 9190 (74.49%) to the other UUP candidates; 1215 (9.85%) to Watson (Ind U); 570 (4.62%) to McQuaid (Alliance); 317 to Carrick and 242 to Allen, thus 559 (4.53%) to the DUP candidates; 250 (2.03%) to Vance (UKUP); 106 (0.86%) to Byrne (SDLP); 99 (0.80%) to Silcock (Ind); 73 (0.59%) to Evans (Lab); 62 (0.50%) to French (WP); 31 (0.25%) to McClinton (Ind U); 13 to O'Hagan and 10 to Murray, thus 23 (0.19%) to the SF candidates; and 7 (0.06%) to Lyons (NLP) with 153 (0.19%) non-transferable.
Stage 3: Of Rodgers' 9260 votes, 6523 (70.44%) went to Byrne (SDLP); 1235 to O'Hagan and 444 to Murray, thus 1679 (18.13%) to the SF candidates; 355 (3.83%) to French (WP); 317 (3.42%) to McQuaid (Alliance); 165 (1.78%) to Evans (Labour); 10 to Savage, 8 to Gardiner and also 8 to Neale, thus 26 (0.28%) to the UUP candidates; 17 (0.18%) to Lyons (NLP); 16 (0.17%) to Silcock (Ind); 9 to Allen and 3 to Carrick, thus 12 (0.13%) to the DUP candidates; 2 to McClinton (Ind U); and none to either Vance (UKUP) or Watson (Ind U) with 148 (1.20%) non-transferable.
| |
Stage 4 | Exclude McClinton | Exclude Evans, French | Exclude Neale | ||||
| David Trimble | UUP | 7200 | |
7200 | |
7200 | |
7200 |
| Brid Rodgers | SDLP | 7200 | |
7200 | |
7200 | |
7200 |
| Dara O'Hagan | SF | 4584.26 | |
4584.26 | 125.18 | 4709.44 | 4.44 | 4713.88 |
| Mervyn Carrick | DUP | 4315.22 | 73.10 | 4388.32 | 10.52 | 4398.84 | 44.22 | 4443.06 |
| Denis Watson | Ind U | 5378.86 | 52.94 | 5431.80 | 15.94 | 5447.74 | 99.04 | 5546.78 |
| George Savage | UUP | 2403.46 | 7.26 | 2410.72 | 21.06 | 2431.78 | 540.30 | 2972.08 |
| Mel Byrne | SDLP | 4185.20 | |
4185.20 | 261.86 | 4447.06 | 10.00 | 4457.06 |
| Ruth Allen | DUP | 3745.04 | 40.52 | 3785.56 | 18.02 | 3803.58 | 25.88 | 3829.46 |
| Samuel Gardiner | UUP | 2470.94 | 10.10 | 2481.04 | 34.42 | 2515.46 | 469.80 | 2985.26 |
| Francie Murray | SF | 3021.52 | 1.00 | 3022.52 | 106.56 | 3129.08 | 3.22 | 3132.30 |
| Frank McQuaid | APNI | 1898.42 | 3.68 | 1902.10 | 156.74 | 2058.84 | 54.94 | 2113.78 |
| David Vance | UKUP | 1514.68 | 15.00 | 1529.68 | 7.26 | 1536.94 | 18.72 | 1555.66 |
| Mark Neale | UUP | 1261.02 | 11.42 | 1272.44 | 22.02 | 1294.46 | -1294.46 | |
| Alan Evans | Labour | 522.36 | 0.42 | 522.78 | -522.78 | |
|
|
| Tom French | WP | 383.64 | 1.00 | 384.64 | -384.64 | |
|
|
| Kenny McClinton | Ind U | 224.30 | -224.3 | |
|
|
|
|
| |
|
|
|
|
|
|
|
|
| non-transferable | |
90.08 | 7.86 | 97.94 | 127.84 | 225.78 | 23.90 | 249.68 |
| |
Stage 7 | Exclude Vance | Exclude McQuaid | Exclude Murray | ||||
| David Trimble | UUP | 7200 | |
7200 | |
7200 | |
7200 |
| Brid Rodgers | SDLP | 7200 | |
7200 | |
7200 | |
7200 |
| Dara O'Hagan | SF | 4713.88 | |
4713.88 | 58.98 | 4772.86 | 2640 | 7412.86 |
| Mervyn Carrick | DUP | 4443.06 | 283.46 | 4726.52 | 13.28 | 4739.80 | 2.22 | 4742.02 |
| Denis Watson | Ind U | 5546.78 | 721.20 | 6267.98 | 83.40 | 6351.38 | 1.64 | 6353.02 |
| George Savage | UUP | 2972.08 | 79.38 | 3051.46 | 396.52 | 3447.98 | 8.58 | 3456.56 |
| Mel Byrne | SDLP | 4457.06 | 3.00 | 4460.06 | 758.78 | 5218.84 | 265.54 | 5484.38 |
| Ruth Allen | DUP | 3829.46 | 373.30 | 4202.76 | 34.88 | 4237.64 | 3.08 | 4240.72 |
| Samuel Gardiner | UUP | 2985.26 | 47.34 | 3032.60 | 381.78 | 3414.38 | 5.28 | 3419.66 |
| Francie Murray | SF | 3132.30 | |
3132.30 | 41.32 | 3173.62 | -3173.62 | |
| Frank McQuaid | APNI | 2113.78 | 19.52 | 2133.30 | -2133.30 | |
|
|
| David Vance | UKUP | 1555.66 | -1555.66 | |
|
|
|
|
| |
|
|
|
|
|
|
|
|
| non-transferable | |
249.68 | 28.46 | 278.14 | 364.36 | 642.5 | 247.28 | 889.78 |
| |
Stage 10 | Surplus O'Hagan | Exclude Gardner | Exclude Allen | ||||
| David Trimble | UUP | 7200 | |
7200 | |
7200 | |
7200 |
| Brid Rodgers | SDLP | 7200 | |
7200 | |
7200 | |
7200 |
| Dara O'Hagan | SF | 7412.86 | -212.86 | 7200 | |
7200 | |
7200 |
| Mervyn Carrick | DUP | 4742.02 | 1.65 | 4743.67 | 128.38 | 4872.05 | 3162.00 | 8034.05 |
| Denis Watson | Ind U | 6353.02 | 0.30 | 6353.32 | 282.86 | 6636.18 | 513.32 | 7149.50 |
| George Savage | UUP | 3456.56 | 0.75 | 3457.31 | 2565.22 | 6022.53 | 331.00 | 6353.53 |
| Mel Byrne | SDLP | 5484.38 | 204.45 | 5688.83 | 97.44 | 5786.27 | 86.54 | 5872.81 |
| Ruth Allen | DUP | 4240.72 | 1.50 | 4242.22 | 133.39 | 4375.61 | -4375.61 | |
| Samuel Gardiner | UUP | 3419.66 | 1.20 | 3420.86 | -3420.86 | |
|
|
| |
|
|
|
|
|
|
|
|
| non-transferable | |
889.78 | 3.01 | 892.79 | 213.57 | 1106.36 | 282.75 | 1389.11 |
Stage 11: Of the 2640 votes transferred to O'Hagan from Murray, 1363 (51.63%) transferred to Byrne (SDLP); 11 to Carrick (DUP) and 10 to Allen, thus 21 (0.80%) to the DUP candidates; 8 to Gardiner and 5 to Savage, thus 13 (0.49%) to the UUP candidates; and 2 (0.08%) to Watson (Ind U) with 1241 (47.01%) non-transferable.
| |
Stage 13 | Surplus Carrick | |
||
| David Trimble | UUP | 7200 | |
7200 | |
| Brid Rodgers | SDLP | 7200 | |
7200 | |
| Dara O'Hagan | SF | 7200 | |
7200 | |
| Mervyn Carrick | DUP | 8034.05 | -834.05 | 7200 | |
| Denis Watson | Ind U | 7149.50 | 642.32 | 7791.82 | |
| George Savage | UUP | 6353.53 | 173.60 | 6527.13 | |
| Mel Byrne | SDLP | 5872.81 | 4.96 | 5877.77 | |
| |
|
|
|
|
|
| non-transferable | |
1389.11 | 13.17 | 1402.28 | |
Stage 14: 3062 votes transferred to Carrick from Allen. It is likely that 2648 of these transferred further (though mathematically the number could also have been 1324). In that case, 2072 (67.67%) went to Watson (Ind U); 560 (18.29%) to Savage (UUP); and 16 (0.52%) to Byrne (SDLP) with 514 (16.79%) non-transferable.
Denis Watson succeeded in breaking through here as a dissident Unionist candidate. There were not quite enough votes for three Nationalist seats; if there had been, the loser would have been David Trimble's running-mate George Savage, leaving the party leader holding his party's only seat in his own constituency.
Full 1998 results for each seat: East Belfast | North Belfast | South Belfast | West Belfast | East Antrim | North Antrim | South Antrim | North Down | South Down | Fermanagh and South Tyrone | Foyle | Lagan Valley | East Londonderry | Mid Ulster | Newry and Armagh | Strangford | West Tyrone | Upper Bann
Other sites based at ARK: ORB (Online Research Bank) | CAIN (Conflict Archive on the INternet) | Northern Ireland Life and Times Survey
Your comments, please! Send an email to me at nicholas.whyte@gmail.com..
Nicholas Whyte, 15 October 2000; modified 16 February 2002.
|
|
Disclaimer:©
Nicholas Whyte 1998-2004 Last Updated onSunday,
21-Mar-2010 10:47
|