

| |
|
|
|
|
|
|
 |
| Map and graph by Conal Kelly | |
This constituency takes in a large part of Newry,
Mourne and Down District Council and a corner of Armagh, Banbridge and Craigavon District
Council. The MP has been Chris Hazzard (SF) since 2017; he
defeated former SDLP party leader Margaret Ritchie, who had held
the seat since 2010; she succeeded Eddy McGrady (SDLP), who had
defeated Enoch Powell (UUP) in 1987. SF hold two Assembly seats
and the SDLP, Alliance, and DUP hold one each. See the 1983-1992 South Down results, the 1973-84 South Down results and the 1950-1970 South Down results.
2019 Westminster notional result on new boundaries:
| DUP | UUP | Cons | Alliance | SDLP | SF | Aontu | ||
| 2019 actual |
7,619 | 3,307 | 6,916 | 14,517 | 16,137 | 1,266 | ||
| 15.3% | 6.6% | 0.0% | 13.9% | 29.2% | 32.4% | 2.5% | ||
| From South Down |
To South Down |
7,417 | 3,219 | 5,987 | 12,032 | 13,374 | 1,049 | |
| From South Down | To Strangford | -60 | -26 | -800 | -2,215 | -2462 | -193 | |
| From South Down | To Newry and Armagh |
-140 | -61 | -127 | -267 | -297 | -23 | |
| From South Down | To Lagan Valley |
-2 | -1 | -2 | -4 | -4 | ||
| From Upper Bann |
To South Down | 574 | 174 | 152 | 83 | 221 | ||
| From Newry and Armagh |
To South Down | 143 | 55 | 55 | 123 | 264 | 21 | |
| From Lagan Valley |
To South Down | 27 | 12 | 1 | 18 | 2 | 2 | |
| From Strangford |
To South Down | 1 | ||||||
| 2019 notional |
8,162 | 3,460 | 1 | 6,212 | 12,240 | 13,861 | 1,070 | |
| 18.1% | 7.7% | - | 13.8% | 27.2% | 30.8% | 2.4% | ||
| +2.8% | +1.0% | - | -0.1% | -2.0% | -1.6% | -0.2% |
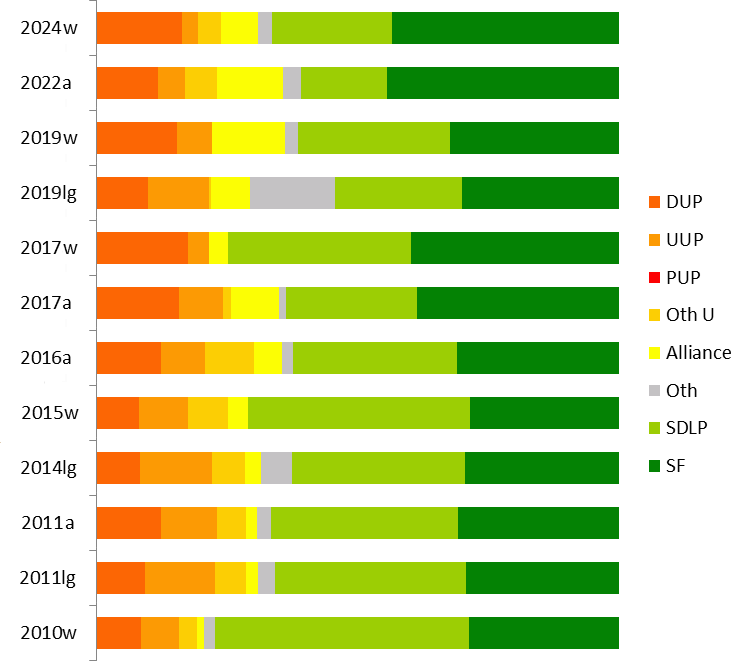
| DUP | UUP | Oth U | Alliance | Oth | SDLP | SF | |
| 2024w | 16.2% |
3.1% |
4.3% |
7.0% |
2.8% |
23.0% |
43.5% |
| 2022a | 11.8% | 5.2% | 6.0% | 12.6% | 3.5% | 16.5% | 44.3% |
| 2019w | 15.3% | 6.6% | 13.9% | 2.5% | 29.2% | 32.4% | |
| 2019lg |
9.8% | 11.6% | 0.3% | 7.4% | 16.4% | 24.3% | 30.1% |
| 2017w | 17.4% | 3.9% | 3.5% | 35.1% | 39.9% | ||
| 2017a |
15.8% | 8.4% | 1.4% | 9.2% | 1.4% | 25.2% | 38.6% |
| 2016a |
12.3% | 8.5% | 9.4% | 5.4% | 2.0% | 31.4% | 31.1% |
| 2015w |
8.2% | 9.3% | 7.8% | 3.8% | 42.3% | 28.5% | |
| 2014lg |
8.5% | 13.6% | 6.4% | 3.0% | 6.0% | 33.0% | 29.4% |
| 2011a |
12.5% | 10.6% | 5.6% | 2.1% | 2.7% | 35.8% | 30.9% |
| 2011lg |
9.1% | 13.2% | 5.7% | 2.2% | 3.2% | 35.7% | 28.5% |
| 2010w | 8.6% | 7.3% | 3.5% | 1.3% | 2.1% | 48.5% | 28.7% |
| 2007a |
15.6% | 8.5% | 3.2% | 1.6% | 6.0% | 32.9% | 32.2% |
| 2005w | 16.1% | 8.7% | 1.3% | 46.9% | 27.0% | ||
| 2005lg | 13.0% | 14.9% | 1.1% | 10.8% | 34.8% | 25.4% |
NB that the figures for elections before 2010 are projections.
Figures for the previous boundaries can be found at the bottom of
this page.
NB also that the Conservatives got 0.8% in 2007 (on the previous
boundaries) and supported the UUP in 2010.
| @Sinéad Ennis (SF)
14,381 (26.2%) Cathy Mason (SF) 9,963 (18.1%) Patrick Brown (Alliance) 6,942 (12.6%) Diane Forsythe (DUP) 6,497 (11.8%) @Colin McGrath (SDLP) 6,082 (11.1%) Harold McKee (TUV) 3,273 (6.0%) Karen McKevitt (SDLP) 3,006 (5.5%) Jill Macauley (UUP) 2,880 (5.2%) Rosemary McGlone (Aontú) 1,177 (2.1%) Noeleen Lynch (Green) 412 (0.7%) Paul McCrory (PBP) 205 (0.4%) Patrick Clarke (Ind) 134 (0.2%) @ member of the Assembly when it was dissolved. |
SF 24,344 (44.3%, +5.7%)
2 seats SDLP 9,088 (16.5%, -8.7%) 1 seat (-1) Alliance 6,942 (12.6%, +3.4%) 1 seat DUP 6,497 (11.8%, -4.0%) 1 seat TUV 3,273 (6.0%, +4.7%) UUP 2,880 (5.2%, -3.2%) Aontú 1,177 (2.1%) Green 412 (0.7%, -0.3%) PBP 205 (0.4%) Ind 134 (0.2%) Electorate: 84,046 Votes cast: 55,631 (66.2%, ±0%), spoilt votes 679 (1.2%) Valid votes: 54,952, quota 9,159 |
*Chris Hazzard (SF) 16,137 (32.4%, -7.5%)
Michael Savage (SDLP) 14,517 (29.2%, -6.0%)
Glyn Hanna (DUP) 7,619 (15.3%, -2.1%)
Patrick Brown (Alliance) 6,916 (13.9%, +10.3%)
Jill Macauley (UUP) 3,307 (6.6%, +2.7%)
Paul Brady (Aontú) 1,266 (2.5%, +2.5%)
* outgoing MP.
Electorate: 79,175; Total Poll: 49,971 (63.1%); Invalid Votes:
209 (0.4%); Valid Votes: 49,762
Hazzard's share of the poll was down on 2017 but fortunately for
him so was the SDLP's. Aontu ate a little into the Nationalist
vote, but Alliance ate into it rather more, with the UUP picking
up from the DUP. In a five-seat Assembly election, these votes
would give SF two seats and one each for the SDLP and DUP. The
last seat would be between a second SDLP and the Alliance, with
the Alliance better positioned.
From the 2011 census, South Down includes:
The entire Newry, Mourne and Down DEA of Downpatrick
@Chris Hazzard (SF) 20,328 (39.9%, +11.4%)
*Margaret Ritchie (SDLP) 17,882 (35.1%, -7.2%)
Diane Forsythe (DUP) 8,867 (17.4%, +8.1%)
Harold McKee (UUP) 2,002 (3.9%, -5.4%)
Andrew McMurray (Alliance) 1,814 (3.5%, -0.3%)
* outgoing MP.
@ member of the Assembly.
Electorate: 75,685; Total Poll: 51,082 (67.5%); Invalid Votes:
189 (0.4%); Valid Votes: 50,893
One of SF's three gains, achieved with a spectacular increase of
over 8,000 votes. In a five-seat Assembly election, these votes
would elect two MLAs from SF and the SDLP, and one from the DUP.
| Sinéad Ennis
(SF) 10,256 (20.8%) @Chris Hazzard (SF) 8,827 (17.9%) @Jim Wells (DUP) 7,786 (15.8%) @Sinéad Bradley (SDLP) 7,323 (14.8%) @Colin McGrath (SDLP) 5,110 (10.3%) Patrick Brown (Alliance) 4,535 (9.2%) @Harold Mckee (UUP) 4,172 (8.4%) Lyle Rea (TUV) 630 (1.3%) Hannah George (Green) 483 (1.0%) Patrick Clarke (Ind) 192 (0.4%) Gary Hynds (Con) 85 (0.2%) @ member of the Assembly when it was dissolved. |
SF 19,083 (38.6%, +7.5%)
2 seats SDLP 12,433 (25.2%, -6.2%) 2 seats DUP 7,786 (15.8%, +3.5%) 1 seat Alliance 4,535 (9.2%, +3.8%) UUP 4,172 (8.4%, -0.1%) 0 seats (-1) TUV 630 (1.3%, -5.3%) Green 483 (1.0%, -1.0%) Ind 192 (0.4%) Con 85 (0.2%) Electorate: 75,415 Votes cast: 49,934 (66.2%, +12.5%), spoilt votes 535 (1.1%) Valid votes: 49,399, quota 8,234 |
| @Jim Wells (DUP) 5,033
(12.3%) @Chris Hazzard (Sinn Féin) 5,045 (12.3%) Sinead Bradley (SDLP) 5,059 (12.3%) @Caitríona Ruane (Sinn Féin) 4,191 (10.2%) Colin McGrath (SDLP) 4,288 (10.4%) @Seán Rogers (SDLP) 3,564 (8.7%) Michael Gray-Sloan (Sinn Féin) 3,520 (8.6%) Harold McKee (UUP) 3,481 (8.5%) Henry Reilly (TUV) 2,718 (6.6%) Patrick Brown (Alliance) 2,200 (5.4%) John McCallister (Independent) 1,156 (2.8%) John Hardy (Green) 820 (2.0%) @ member of the Assembly when it was dissolved. |
SDLP 12,911 (31.4%,
-4.4%) 2 seats Sinn Féin 12,756 (31.1%, +0.2%) 2 seats DUP 5,033 (12.3%, -0.2%) 1 seat UUP 3,481 (8.5%, -2.1%) 1 seat TUV 2,718 (6.6%) Alliance 2,200 (5.4%, +3.3%) Independent 1,156 (2.8%) Green 820 (2.0%, -0.7%) Electorate: 77,409 Votes cast: 41,645 (53.7%); spoilt votes 570 (1.4%) Valid votes: 41,075; quota: 5,868 |
*Margaret Ritchie (SDLP) 18,077 (42.3%, -6.1%)
Chris Hazzard (SF) 12,186 (28.5%, -0.2%)
Harold McKee (UUP) 3,964 (9.3%, +2.0%)
Jim Wells (DUP) 3,486 (8.2%, -0.4%)
Henry Reilly (UKIP) 3,044 (7.1%)
Martyn Todd (Alliance) 1,622 (3.8%, +2.5%)
Felicity Buchan (Conservative) 318 (0.7%)
Electorate: 75,220; Total Poll: 43,000 (57.2%); Invalid Votes: 303
(0.7%); Valid Votes: 42,697
A fall in the SDLP vote which (here as elsewhere) was not matched by a rise in SF support - indeed, a naive reading of the figures would suggest that the disaffected SDLP voters had moved to UKIP, though this seems a bit unlikely.
If cast in a six-seat Assembly election, these votes would give
the SDLP three seats, SF two and the UUP one.
From the 2011 census, South Down includes:
The entire Newry, Mourne and Down DEA of Downpatrick
| Margaret Ritchie (SDLP) 8,506 (20.4%) Caitriona Ruane (SF) 5,955 (14.3%) Jim Wells (DUP) 5,200 (12.5%) John McCallister (UUP) 4,409 (10.6%) Willie Clarke (SF) 3,882 (9.3%) Karen McKevitt (SDLP) 3,758 (9.0%) Naomi Bailie (SF) 3,050 (7.3%) Eamonn O'Neill (SDLP) 2,663 (6.4%) Henry Reilly (UKIP) 2,332 (5.6%) Cadogan Enright (Green) 1,107 (2.7%) David Griffin (Alliance) 864 (2.1%) @ member of the Assembly when it was dissolved. |
SDLP 14,927 (35.8%,
+2.8%) 2 seats SF 12,887 (30.9%, -1.3%) 2 seats DUP 5,200 (12.5%, -3.1%) 1 seat UUP 4,409 (10.6%, +2.1%) 1 seat UKIP 2,332 (5.6%, +2.9%) Green 1,107 (2.7%, -0.9%) Alliance 864 (2.1%, +0.6%) Electorate: 73,240 Votes cast: 42,551 (58.1%); spoilt votes 825 (1.9%) Valid votes: 41,276; quota: 5,961 |
@Margaret Ritchie (SDLP) 20,648
(48.5%, +1.7%)
@Caitriona Ruane (Sinn Féin) 12,236 (28.7%, +1.7%)
@Jim Wells (DUP) 3,645 (8.6%, -7.5%)
@John McCallister (UCUNF) 3,093 (7.3% -1.5%)
Ivor McConnell (TUV) 1,506 (3.5%)
Cadogan Enright (Green) 901 (2.1%)
David Griffin (Alliance) 560 (1.3%, ±0%)
Electorate: 70,784; Total Poll: 42,840 (60.5%); Invalid Votes: 251
(0.6%); Valid Votes: 42,589
@ elected to the Northern Ireland Assembly from this constituency
The SDLP's new leader, Margaret Ritchie, can feel content that she actually improved the SDLP vote here. If cast in a six-seat Assembly election, these votes would give the SDLP three seats, SF two and the DUP one, thus an SDLP gain from the UUP.
| *Caitriona Ruane (SF)
6334 (13.7%) *Margaret Ritchie (SDLP) 5838 (12.7%) *P.J. Bradley (SDLP) 5652 (12.3%) *Jim Wells (DUP) 5542 (12.0%) *Willie Clarke (SF) 5138 (11.1%) John McCallister (UUP) 4447 (9.6%) Michael Carr (SDLP) 2972 (6.4%) Eamonn McConvey (SF) 2662 (5.8%) William Burns (DUP) 2611 (5.7%) Ciaran Mussen (Green) 1622 (3.5%) Henry Reilly (UK Independence Party) 1229 (2.7%) David Griffin (Alliance) 691 (1.5%) Martin Cunningham (Independent) 434 (0.9%) Frederick Wharton (UKUP) 424 (0.9%) Peter Bowles (Conservative) 391 (0.8%) Malachi Curran (Labour) 123 (0.3%) *Elected in 2003 from South Down |
SDLP 14,462 (31.4, -3.7%) 2 seats SF 14,134 (30.7%, +4.2%) 2 seats DUP 8,153 (17.7%, +2.7%) 1 seat UUP 4,447 (9.6%, -8.6%) 1 seat Green 1,622 (3.5%, +1.8%) UKIP 1,229 (2.7%) Alliance 691 (1.5%, +0.4%) Cunningham 434 (0.9%) UKUP 424 (0.9%, +0.4%) Conservative 391 (0.8%) Labour 123 (0.3%) Electorate 71,704 Votes cast 46,623 (65.0%); spoilt votes 513 (1.1%) Valid votes 46,110; quota 6,588 |
*Eddie McGrady (SDLP) 21,557 (44.7% -1.6%)
@Caitriona Ruane (Sinn Fein) 12,417 (25.8% +6.1%)
@Jim Wells (DUP) 8,815 (18.3% +3.3%)
@Dermot Nesbitt (UUP) 4,775 (9.9% -7.7%)
Julian Crozier (Alliance) 613 (1.3% +/- 0.0.%)
* outgoing MP.
@ Member of the Assembly
If these votes were cast in a six-seat STV election, the SDLP would win three seats, and SF and the DUP one each. The last seat would be most likely to go to SF.
SDLP 16,290.1 (34.5%)
Sinn Fein 11,396.2 (24.1%)
UUP 7,417.5 (15.7%)
DUP 7,231.8 (15.3%)
Green 1,650.8 (3.5%)
Alliance 535.2 (1.1%)
WP 97 (0.2%)
Independents 2,622 (5.6%)
These votes, if cast in a six-seat STV election, would porbably give the SDLP and SF two seats each, and the UUP and DUP one each.
| *Jim Wells (DUP) 6789 (15.0%) *Dermot Nesbitt (UUP) 5368 (11.8%) *P.J. Bradley (SDLP) 5337 (11.8%) Catriona Ruane (SF) 5118 (11.3%) Margaret Ritchie (SDLP) 4261 (9.4%) Willie Clarke (SF) 4083 (9.0%) *Eamonn O'Neill (SDLP) 3942 (8.7%) Jim Donaldson (UUP) 2885 (6.4%) Eamonn McConvey (SF) 2806 (6.2%) Marian Fitzpatrick (SDLP) 2382 (5.3%) Raymond Blaney (Green) 799 (1.8%) Trudy Miller (NIWC) 565 (1.2%) Neil Powell (Alliance) 489 (1.1%) Nelson Wharton (UKUP) 245 (0.5%) Malachi Curran (Ind) 162 (0.4%) Desmond O'Hagan (WP) 115 (0.3%) |
SDLP 15,922 (35.1%, -10.2%) 2 seats SF 12,007 (26.5%, +11.4%) 2 seats UUP 8,253 (18.2%, +3.8%) 1 seat DUP 6,789 (15.0%, +5.6%) 1 seat Green 799 (1.8%) NIWC 565 (1.2%, -2.0%) Alliance 489 (1.1%, -1.8%) UKUP 245 (0.5%, -4.5%) Ind 162 (0.4%) WP 115 (0.3%, +/-0.0%) Electorate 70,149 |
Initial reaction: One of several seats where SF gained
from the SDLP. On the final count, 542 votes of Nesbitt's surplus
of 1847 (originally votes from Jim Donaldson) went fairly evenly
split between the SDLP candidates, 17 evenly between the two SF
candidates, and the other 1288 non-transferable. Had the SDLP
candidates got twice as much from the UUP they would both have
been ahead of SF's Clarke for the last seat. As it was Margaret
Ritchie edged out incumbent Eamonn O'Neill by the second smallest
margin of the election, 36 votes.
South Down had lost 9.54% of its electorate in the great electoral register shake-out, varying from 17.60% in the Bracken and Kilbroney ward of Newry and Mourne to 4.55% in the Rathfriland ward of Banbridge. 6 constituencies lost fewer voters, 11 lost more.
Electorate: 73,519; votes cast: 52,648 (71.6%); spoilt votes: 574
(1.0%)
Valid votes: 52,074; SDLP majority 13,858
* outgoing MP
@ Member of the Assembly
No surprise in the result, though again the increase in the SF vote was striking. A six-seat Assembly election here would give the SDLP three seats and the other three big parties one each.
SDLP 20450.7 (40%)
SF 10235.8 (20%)
UUP 9820.0 (19%)
DUP 6933.2 (14%)
UKUP 193.5 (0.4%)
WP 115 (0.2%)
NIUP 9 (0.02%)
Independents 3388.6 (7%)
Total valid 51145.8
Extrapolating from the local government elections is very difficult because the South Down constituency breaches no less than four local electoral area boundaries. If we make some reasonable adjustments, we get the figures above for the whole South Down constituency. These would give the SDLP three seats, and Sinn Fein, the UUP and the DUP one each.
| *Eddie McGrady (SDLP) 10,373 *Mick Murphy (SF) 6,251 P.J. Bradley (SDLP) 5,571 *Dermot Nesbitt (UUP) 5,480 Jim Wells (DUP) 4,826 *Hugh Carr (SDLP) 3,731 Eamonn O'Neill (SDLP) 3,582 Frederick Wharton (UKU) 2,576 Norman Hanna (UUP) 1,939 Anne Carr (NIWC) 1,658 George Graham (Unionist) 1,562 Garret O'Fachtna (SF) 1,520 Anne-Marie Cunningham (All) 1,502 #Malachi Curran (Lab) 498 Desmond O'Hagan (WP) 130 Patrick O'Connor (Ind Lab) 121 Thomas Mullins (NLP) 33 |
SDLP 23,257 (45.29%) 3 seats
SF 7,771 (15.13%) 1 seat UUP 7,419 (14.45%) 1 seat DUP 4,826 (9.40%) 1 seat UKU 2,576 (5.02%) NIWC 1,658 (3.23%) Unionist 1,562 (3.04%) Alliance 1,502 (2.92%) Lab 498 (0.97%) WP 130 (0.25%) Ind Lab 121 (0.24%) NLP 33 (0.06%) Electorate: 71,027 |
* elected in 1996 Forum/talks election from South Down
# elected in 1996 Forum/talks election as a 'top-up' candidate.
Not a surprising result, but a good one for the SDLP in what is now their second strongest constituency. As in neighbouring Newry and Armagh, the UUP won only one seat despite having held this constituency at Westminster until 1987. Hugh Carr, the runner-up, was almost a thousand votes adrift of his running-mate Eamonn O'Neill (by 5,187 to 6,163) with surpluses of 53 votes from Bradley and 833 from Wells left undistributed.
Social Democratic and Labour Party 17,515.1 (43%)
Ulster Unionist Party 10,176.9 (25%)
Sinn Féin 4,015.2 (10%)
Democratic Unionist Party 3,899.2 (10%)
Alliance Party of Northern Ireland 1419.8 (3%)
Women's Coalition 430 (1%)
Labour 327 (1%)
Workers Party 210 (1%)
Green Party 113 (0.28%)
Others 2,330 (6%)
Total valid 40708.5 (57.91%)
Social Democratic and Labour Party (SDLP) 20,220 (43%) 3 seats
(Edward McGrady, Hugh Carr, Margaret Ritchie elected)
Ulster Unionist Party (UUP) 10,379 (22%) 1 seat (Dermot Nesbitt
elected)
Sinn Féin (SF) 6,142 (13%) 1 seat (Mick Murphy elected)
Democratic Unionist Party (DUP) 5,060 (10%)
Alliance Party of Northern Ireland (APNI) 1,685 (4%)
Labour (Lab) 927 (2%)
Progressive Unionist Party (PUP) 497 (1%)
Northern Ireland Women's Coalition (NIWC) 464 (1%)
Ulster Democratic Party (UDP) 404 (1%)
Green Party 251 (1%)
Conservative Party (Con) 197 (0.42%)
Workers Party (WP) 162 (0.35%)
Ulster Independence Movement (UIM) 130 (0.28%)
Democratic Partnership 117 (0.25%)
Democratic Left (DL) 65 (0.14%)
Natural Law Party (NLP) 30 (0.06%)
Independent Chambers 18 (0.04%)
Electorate: 69,035; votes cast: 46,891 (67.9%); spoilt votes: 143 (0.3%); valid votes: 46,748
McGrady had been elected to the 1973 Assembly, the 1975 Convention, and the 1982 Assembly from South Down.
| DUP | UUP | Oth U | Alliance | Oth | SDLP | SF | |
| 2007a |
18% | 10% | 4% | 1% | 5% | 31% | 31% |
| 2005w | 18% | 10% | 1% | 45% | 26% | ||
| 2005lg | 15% | 16% | 1% | 10% | 34% | 24% | |
| 2003a | 15% | 18% | 1% | 1% | 4% | 35% | 26% |
| 2001w | 15% | 18% | 1% | 46% | 20% | ||
| 2001lg | 14% | 19% | 0% | 7% | 40% | 20% | |
| 1998a | 9% | 14% | 8% | 3% | 5% | 45% | 15% |
| 1997lg | 10% | 25% | 3% | 8% | 43% | 10% | |
| 1997w | 33% | 3% | 0% | 53% | 10% | ||
| 1996f | 10% | 22% | 2% | 4% | 5% | 43% | 13% |
See also: Full 2003 results from South Down | Full 1998 results from South Down | The Boundary Commission's Provisional Recommendations | Boundary Commission 2003 | Jim Riley's analysis of votes and seats in the 1998 Assembly election | The constituencies
Other sites based at ARK: ORB (Online Research Bank) | CAIN (Conflict Archive on the INternet) | Northern Ireland Life and Times Survey
Your comments, please! Send an email to me at nicholas.whyte@gmail.com.
 |
This page has been developed with the support of a project grant from the New Initiatives Fund of the Electoral Commission. However, any views expressed on this page or, in particular, other pages of this website are those of the author and not necessarily shared by The Electoral Commission. |
Nicholas Whyte, 3 June 1998; last updated 7 May 2022 by Conal Kelly.
|
Disclaimer:� Nicholas Whyte 1998-2015
|