

|
|
|
| |
| |
Local
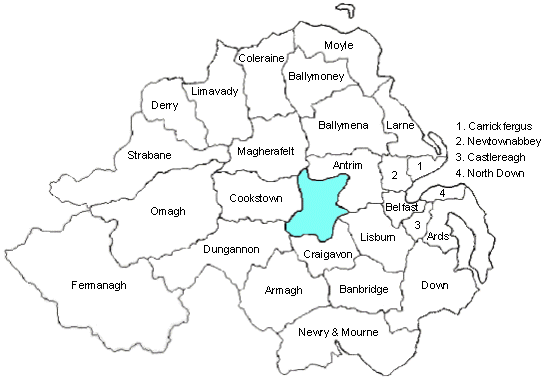
Government Elections 1985 - 1989: Armagh
Summary
| 1989 Results | 1985 Results |
| Votes by Party: UUP: 11,631 (%), 11 councillors DUP: 3,054 (%), 2 councillors SF: 2,050 (%), 1 councillor SDLP: 7,931 (%), 8 councillors WP: 232 Lab: 100 |
Votes by Party: OUP: 10,287 (43.8%), 11 councillors DUP: 3,985 (17.0%), 3 councillors SF: 1,515 (6.4%), 1 councillor SDLP: 7,076 (30.1%), 7 councillors Ind N: 640 (2.7%) |
| Electorate: 34,967; votes cast: 25,620; spoilt votes: 622 (%); valid votes: 24,998 (%) | Electorate: 34,374; votes cast: 23,895; spoilt votes: 392 (1.6%); valid votes: 23,503 (98.4%) |
Armagh
City
1989 Results
|
First Count: |
Votes by Party: UUP: 1,877 (29.6%), 2 seats DUP: 660 (10.4%) SF: 845 (13.3%), 1 seat SDLP: 2,728 (43.0%), 3 seats WP: 232 (3.7%) |
| Electorate: 9,628;
seats: 6; votes cast: 6,544; spoilt votes: 202 (3.1%); valid votes: 6,342 (96.9%); quota: 907 |
| First Count: T. Carroll, (SF) 970 W. G. Knipe, (DUP) 756 J. A. Agnew, (SDLP) 739 J. A. Doogan, (OUP) 645 B. McManus, (Ind N) 640 G. Macartney, (OUP) 620 P. Brannigan, (SDLP) 612 R. J. Orr, (OUP) 564 O. A. Tobin, (SDLP) 476 |
Votes by Party: OUP: 1,829 (30.4%), 2 seats DUP: 756 (12.6%), 1 seat SF: 970 (16.1%), 1 seat SDLP: 1,827 (30.3%), 2 seats Ind N: 640 (10.6%) |
| Electorate: 9,766;
seats: 6; votes cast: 6,122; spoilt votes: 100 (1.6%); valid votes: 6,022 (98.4%); quota: 861 |
Armagh Crossmore
1989 Results
| First Count: J. Nicholson, (UUP) 1,484 T. Kavanagh, (SDLP) 1,162 J. P. McKernan, (SDLP) 1,041 C. J. Mallon, (SDLP) 643 T. Carroll, (SF) 475 T. A. Shilliday, (UUP) 440 |
Votes by Party: UUP: 1,924 (36.7%), 2 seats SF: 475 (9.1%) SDLP: 2,846 (54.3%), 3 seats |
| Electorate: 7,295;
seats: 5; votes cast: 5,403; spoilt votes: 158 (2.9%); valid votes: 5,245 (97.1%); quota: 875 |
| First Count: C. J. Mallon, (SDLP) 1,072 J. F. Nicholson, (OUP) 949 J. P. McKernan, (SDLP) 889 T. McArdle, (SDLP) 837 R. J. McBride, (DUP) 524 T. A. Shilliday, (OUP) 513 |
Votes by Party: OUP: 1,462 (30.6%), 2 seats DUP: 524 (10.9%) SDLP: 2,798 (58.5%), 3 seats |
| Electorate: 7,459;
seats: 5; votes cast: 4,921; spoilt votes: 137 (2.8%); valid votes: 4,784 (97.2%); quota: 798 |
Armagh
Cusher
1989 Results
| First Count: E. A. Speers, (UUP) 1,561 T. J. Black, (DUP) 1,444 T. W. Johnston, (UUP) 1,314 T. A. Canavan, (SDLP) 1,154 R. W. Turner, (UUP) 936 J. Clayton, (UUP) 822 M. L. McNally, (SF) 329 E. Turley, (Lab) 100 |
Votes by Party: UUP: 4,633 (60.5%), 4 seats DUP: 1,444 (18.9%), 1 seat SF: 329 (4.3%) SDLP: 1,154 (15.1%), 1 seat Lab: 100 (1.2%) |
| Electorate: 9,988;
seats: 6; votes cast: 7,811; spoilt votes: 151 (1.9%); valid votes: 7,660 (98.1%); quota: 1,095 |
| First Count: E. A. Speers, (OUP) 1,267 S. Mallon, (SDLP) 1,260 T. W. Johnston, (OUP) 1,149 T. J. Black, (DUP) 1,009 J. Clayton, (OUP) 939 R. Turner, (OUP) 901 M. Spratt, (DUP) 546 |
Votes by Party: OUP: 4,256 (60.2%), 4 seats DUP: 1,555 (22.0%), 1 seat SDLP: 1,260 (17.8%), 1 seat |
| Electorate: 9,467;
seats: 6; votes cast: 7,134; spoilt votes: 63 (0.9%); valid votes: 7,071 (99.1%); quota: 1,011 |
Armagh
Orchard
1989 Results
| First Count: J. A. Speers, (UUP) 1,665 J. P. Kernan, (SDLP) 1,203 D. Hutchinson, (DUP) 950 S. Foster, (UUP) 855 O. M. Whitten, (UUP) 677 B. P. Casey, (SF) 401 |
Votes by Party: UUP: 3,197 (55.6%), 3 seats DUP: 950 (16.5%), 1 seat SF: 401 (7.0%) SDLP: 1,203 (20.9%), 1 seat |
| Electorate: 8,056;
seats: 5; votes cast: 5,862; spoilt votes: 111 (1.9%); valid votes: 5,751 (98.1%); quota: 959 |
1985 Results
| First Count: J. A. Speers, (UUP) 1,189 D. Hutchinson, (DUP) 1,150 R. W. Allen, (UUP) 875 S. Foster, (UUP) 676 C. McAnallen, (SDLP) 612 F. P. McIlvanna, (SDLP) 579 B. McCartan, (SF) 545 |
Votes by Party:
|
| Electorate: 7,682;
seats: 5; votes cast: 5,718; spoilt votes: 92 (1.6%); valid votes: 5,626 (98.4%); quota: 938 |
Local council election
results from 1985 to 1989: Antrim | Ards
| Armagh | Ballymena | Ballymoney
| Banbridge | Belfast
| Carrickfergus | Castlereagh
| Coleraine | Cookstown
| Craigavon | Derry
| Down | Dungannon
| Fermanagh | Larne
| Limavady | Lisburn
| Magherafelt | Moyle
| Newry and Mourne | Newtownabbey
| North Down | Omagh
| Strabane
Local council election results from 1993 to 2001: Antrim
| Ards | Armagh | Ballymena
| Ballymoney | Banbridge
| Belfast | Carrickfergus
| Castlereagh | Coleraine
| Cookstown | Craigavon
| Derry | Down | Dungannon
| Fermanagh | Larne
| Limavady | Lisburn
| Magherafelt | Moyle
| Newry and Mourne | Newtownabbey
| North Down | Omagh
| Strabane
Results from 1983 to 1995 for each seat: East Belfast | North Belfast | South Belfast | West Belfast | East Antrim | North Antrim | South Antrim | North Down | South Down | Fermanagh and South Tyrone | Foyle | Lagan Valley | East Londonderry | Mid Ulster | Newry and Armagh | Strangford | Upper Bann
Surveys of each recent election: 2001 Westminster | 2001 local govt | 2000 S Antrim | 1999 European | 1998 Assembly | 1997 local govt | 1997 Westminster| 1996 Forum | 1995 N Down | 1994 European | 1993 local govt | 1992 Westminster | 1989 local govt | 1987 Westminster | 1986 by-elections | 1985 local govt | 1983 Westminster | 1982 Assembly | 1981 local govt | 1979 Westminster | 1977 local govt | 1975 Convention | Oct 1974 Westminster | Feb 1974 Westminster | 1973 Assembly | 1973 local govt | Summary of all Northern Ireland elections since 1973 | Brief summary of election results 1997-2003
Other sites based at ARK: ORB (Online Research Bank) | CAIN (Conflict Archive on the INternet) | Northern Ireland Life and Times SurveyFront Page | Site Map | Notes and Queries | Updates Mailing List | About this Site
Your comments, please! Send
an email to me at explorers@whyte.com.
 |
This page has been developed with the support of a project grant from the New Initiatives Fund of the Electoral Commission. However, any views expressed on this page or, in particular, other pages of this website are those of the author and not necessarily shared by The Electoral Commission. |
|
Disclaimer:©
Nicholas Whyte 1998-2004 Last Updated on Wednesday, 12-Jan-2005 12:12
|