
 |
 |
|
|
|
|


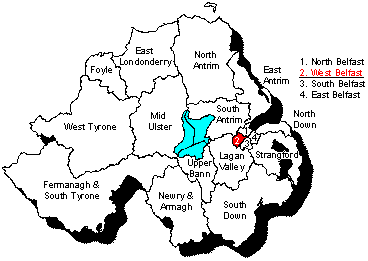
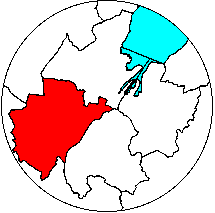
Maps by
Conal
Kelly and Nicholas Whyte
See
also results
of all West Belfast elections 1993-2010
and full counts from 1998 and 2007. Spreadsheet
for 2003 here.
| |
|
|
Surplus Adams |
Exclude Kerr, Ayers, MacVicar & Lowry
|
Exclude Smyth & McGimpsey |
Exclude Hendron |
||||
| Gerry Adams | SF | 6199 | -1505 | 4694 | 0 | 4694 | 0 | 4694 | 0 | 4694 |
| Alex Attwood | SDLP | 3667 | 129.6 | 3796.6 | 104.44 | 3901.04 | 55.24 | 3956.28 | 2140 | 6096.28 |
| Bairbre De Brun | SF | 4069 | 407.52 | 4476.52 | 18.44 | 4494.96 | 9.24 | 4504.2 | 161.48 | 4665.68 |
| Fra McCann | SF | 4263 | 74.16 | 4337.16 | 23.72 | 4360.88 | 2.48 | 4363.36 | 161.64 | 4525 |
| Michael Ferguson | SF | 3849 | 63.84 | 3912.84 | 8.72 | 3921.56 | 23.56 | 3945.12 | 54.88 | 4000 |
| Diane Dodds | DUP | 2544 | 0 | 2544 | 87 | 2631 | 1513.24 | 4144.24 | 112 | 4256,24 |
| Sue Ramsey | SF | 2988 | 685.2 | 3673.2 | 26.48 | 3699.68 | 6.24 | 3705.92 | 62.92 | 3768.84 |
| Joe Hendron | SDLP | 2583 | 71.28 | 2654.28 | 195.44 | 2849.72 | 259 | 3108.72 | -3108.72 | - |
| Chris McGimpsey | UUP | 1170 | 4.56 | 1174.56 | 124 | 1298.56 | -1298.56 | - | |
- |
| Hugh Smyth | PUP | 813 | 1.68 | 814.68 | 48 | 862.68 | -862.68 | - | |
- |
| John Lowry | WP | 407 | 3.84 | 410.84 | -410.84 | - | |
- | |
- |
| John MacVicar | Ind | 211 | 0.24 | 211.24 | -211.24 | - | |
- | |
- |
| Kathryn Ayers | Alliance | 75 | 3.12 | 78.12 | -78.12 | - | |
- | |
- |
| David Kerr | Ulster Third Way | 16 | 0 | 16 | -16 | - | |
- | |
- |
| |
|
|
59.96 | 59.96 | 79.96 | 139.92 | 292.24 | 432.16 | 415.8 | 847.96 |
| |
|
|
Surplus Attwood
|
Surplus De Brun
|
Surplus McCann
|
|||
| Gerry Adams | SF | 4694 | 0 | 4694 | 0 | 4694 | 0 | 4694 |
| Alex Attwood | SDLP | 6096.28 | -1402.28 | 4694 | 0 | 4694 | 0 | 4694 |
| Bairbre De Brun | SF | 4665.68 | 564 | 5229.68 | -535.68 | 4694 | 0 | 4694 |
| Fra McCann | SF | 4525 | 380 | 4905 | 0 | 4905 | -211 | 4694 |
| Michael Ferguson | SF | 4000 | 117 | 4117 | 229 | 4346 | 102.6 | 4448.6 |
| Diane Dodds | DUP | 4256.24 | 16 | 4272.24 | 2 | 4274.24 | 2.85 | 4277.09 |
| Sue Ramsey | SF | 3768.84 | 155 | 3923,84 | 161 | 4084.84 | 105.45 | 4190.29 |
| |
|
847.96 | 170.28 | 1018.24 | 143.68 | 1161.92 | 0.1 | 1162.02 |
Stage 7: Of the 564 votes transferred from Hendron to Attwood and then on to De Brun (so from SDLP to SF), 229 went on to Ferguson and 161 to Ramsey, thus 390 (69.1%) to the continung SF candidates; and 2 (0.4%) to Dodds (DUP) with 172 (30.5%) non-transferable.
Stage 8: Of the 380 votes transferred from Hendron to Attwood and then on to McCann, 111 went on to Ramsey and 108 to Ferguson, thus 219 (57.6%) to the continuing SF candidates; and 3 (0.8%) to Dodds with 158 (41.6%) non-transferable.
See also: Jim Riley's analysis of votes and seats in the 1998 Assembly election | The constituencies | Single Transferable Vote | The political parties | Useful books and links
Full 2003 results for each seat: East Belfast | North Belfast | South Belfast | West Belfast | East Antrim | North Antrim | South Antrim | North Down | South Down | Fermanagh and South Tyrone | Foyle | Lagan Valley | East Londonderry | Mid Ulster | Newry and Armagh | Strangford | West Tyrone | Upper Bann
Other sites based at ARK: ORB (Online Research Bank) | CAIN (Conflict Archive on the INternet) | Northern Ireland Life and Times Survey
Your comments, please! Send an email to me at nicholas.whyte@gmail.com..
Compiled by Nicholas Whyte, 12 April 2004.
|
Disclaimer:© Nicholas Whyte 1998-2004 Last
Updated on
Sunday, 21-Mar-2010
10:39
|